Refer to the p chart in Section 8.2 Exercise 6 of the text. According to this p chart, is the process within statistical control? If not, provide a reason why not. a. It does not appear to be within statistical control because at least one point is more extreme than the UCL or LCL. b. It appears to be within statistical control. c. It does not appear to be within statistical control because there is an obvious non-random trend, cycle, or pattern in the points. d. It does not appear to be within statistical control because at least 8 consecutive points are located all above or all below the centerline.


Inverse Normal Distribution
The method used for finding the corresponding z-critical value in a normal distribution using the known probability is said to be an inverse normal distribution. The inverse normal distribution is a continuous probability distribution with a family of two parameters.
Mean, Median, Mode
It is a descriptive summary of a data set. It can be defined by using some of the measures. The central tendencies do not provide information regarding individual data from the dataset. However, they give a summary of the data set. The central tendency or measure of central tendency is a central or typical value for a probability distribution.
Z-Scores
A z-score is a unit of measurement used in statistics to describe the position of a raw score in terms of its distance from the mean, measured with reference to standard deviation from the mean. Z-scores are useful in statistics because they allow comparison between two scores that belong to different normal distributions.
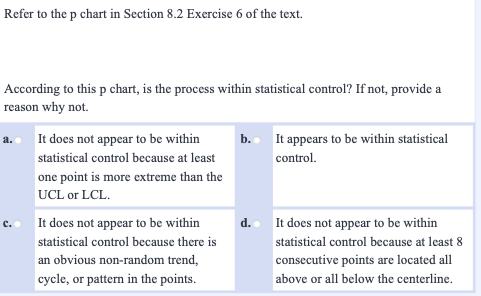
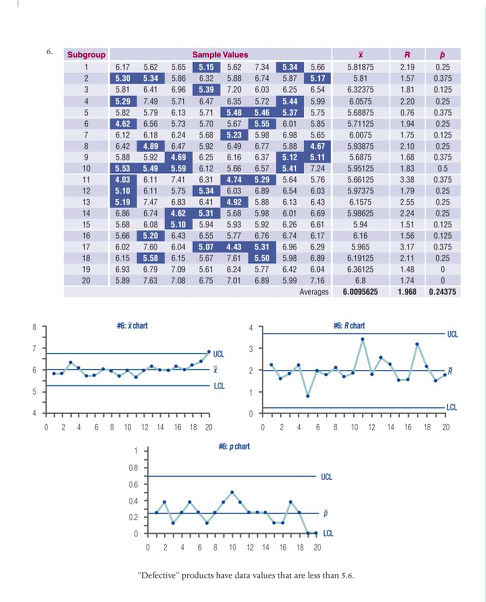
Refer to the p chart in Section 8.2 Exercise 6 of the text.
According to this p chart, is the process within statistical control? If not, provide a reason why not.
| a. | It does not appear to be within statistical control because at least one point is more extreme than the UCL or LCL. | b. | It appears to be within statistical control. |
|---|---|---|---|
| c. | It does not appear to be within statistical control because there is an obvious non-random trend, cycle, or pattern in the points. | d. | It does not appear to be within statistical control because at least 8 consecutive points are located all above or all below the centerline. |


Trending now
This is a popular solution!

Step by step
Solved in 2 steps


