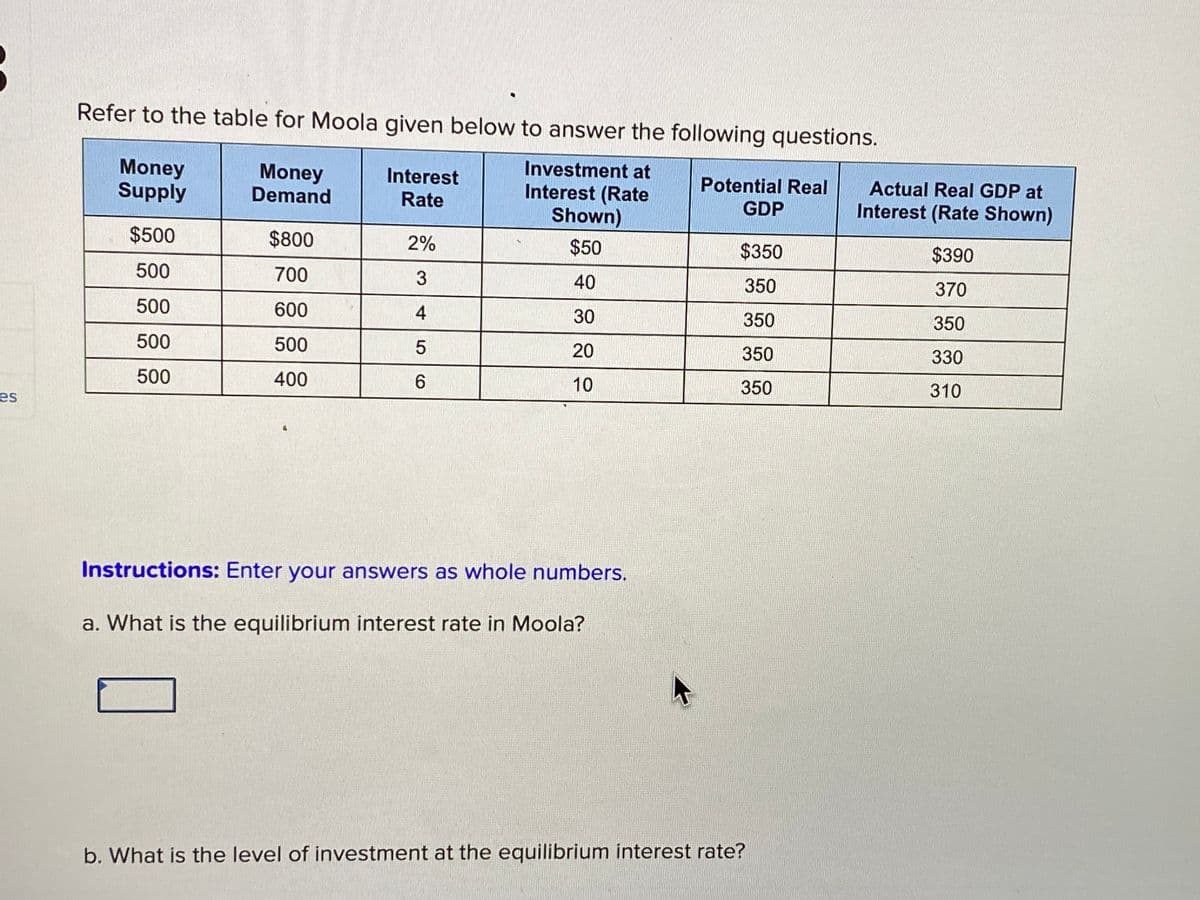
Refer to the table for Moola given below to answer the following questions. Money Supply Money Demand Interest Rate Investment at Interest (Rate Shown) Potential Real GDP Actual Real GDP at Interest (Rate Shown) $500 $800 2% $50 $350 $390 500 700 40 350 370 500 600 4 30 350 350 500 500 20 350 330 500 400 10 350 310 Instructions: Enter your answers as whole numbers. a. What is the equilibrium interest rate in Moola? b. What is the level of investment at the equilibrium interest rate?
Q: Refer to the graph. If the initial equilibrium interest rate was 5 percent and the money supply…
A: Given: Equilibrium Interest Rate is 5%. In the diagram, only money demand curve is given.…
Q: Consider the following economy: Consumers hold no cash The reserve ratio (that we labeled 0 in…
A: Money Demand: $Y(0.7-3.1i) $Y=$2.4 trillion Money supply=$1 trillion For equilibrium interest…
Q: C = 0.8(1 − t)Y I = 900 50i G = 2,000 M t = 0.25 L = 0.5Y 125i 1,500 P Task 1. Derive the equations…
A:
Q: .......... implies that an increase in .......... will increase ........... a.Neutrality of…
A: Money supply refers to the total supply of money, that is circulating in the economy. The money…
Q: Which of the following pairs of events will definitely lead to a decrease in the equilibrium…
A:
Q: Assume the Bank of Canada conducts an open market purchase, which increases real GDP. What happens…
A: The central bank practice of purchasing and selling treasury securities, as well as other assets, on…
Q: Suppose that money demand is given by Md = $Y(0.45 – 0.4i) where SY is $90. Answer the Following…
A: the money supply refers to the total volume of money held by the public at a particular point in…
Q: 2.4 Use the money demand and money supply model to show graphically and briefly explain the effect…
A: Money demand is the total amount of money that an economy wants to hold. Money supply is the total…
Q: Find the level of income Y and the rate of interest i that simultaneously bring equilibrium to the…
A: IS-LM MS= 1000 C = 950 +0. Y I = 310-125i Mw= 264-125i Mt= 0.15Y So, MS = Mw+Mt , Y=C+I…
Q: Assume that the money demand function is (M/P)^d= 2200 – 20000i, where i is the interest rate. The…
A: At equilibrium, real money demand is equal to real money supply. Therefore, at equilibrium, MPd=MP…
Q: ....... implies that an increase in .... will increase ...... a) neutrality of money / inflation /…
A: Answer: Correct option: c (neutrality of money / the money supply / nominal interest rates)…
Q: (M/P)d = 1,000 − 100r, M = 1000 P = 2. a) Graph the supply and demand for real money balances. b)…
A: In the study of macroeconomics, The LM curve can be defined as the liquidity preference and money…
Q: QUESTION Consider the model of money demand we saw in class. Let the elasticity of money demand with…
A: Elasticity of money demand refers to the rate of change of money demand with respect to income or…
Q: Rate (%) 10% 8% 6% MD 100 200 Money (S million) 25. Refer to Figure 3. If the money supply increases…
A: The cash supply is the aggregate sum of cash—money, coins, and balances in financial…
Q: Exhibit: IS-LM to Aggregate Demand Interest rate, r LM₁ (P = P₁, M = M₁) LM₂ (P = P₂, M = M₂) LM₂ (P…
A: "In macroeconomics, LM curve depicts the combinations of income/output Y and interest rate r which…
Q: The IS curve represents A. the single level of output where the goods market is in equilibrium. B.…
A: “Since you have asked multiple questions, we will solve the first question for you. If you want any…
Q: Suppose that the following equations describe goods and money market equilibrium (symbols are as…
A: IS curve depicts the combination of interest rate and equilibrium output which clears the goods…
Q: Suppose that the money demand function is (M/ P)^d = 1000-100r where r is the interest rate in…
A: The demand for money is the total amount of money that the population of an economy wants to hold..…
Q: Canvas Question 3 Determine the equilibrium income and interest rate given the following information…
A: Given: C=0.8Y+100 I=-20r+1000 MS=2375 L1=0.1Y L2=-25r+2000
Q: Says law in money market may not hold if supply of money is a function of interest rate ( M= M +…
A: According to the Classical position, Say's Law hold in a money economy
Q: 1. For each of the following economic changes, predict what will happen to equilibrium interest rate…
A: The quantity theory of money states that the general level of price of services and goods is in turn…
Q: Suppose that the money demand function is (M/P)d = 1,000 - 100r, where r is the interest rate in…
A: Hi! thank you for the question but as per the guidelines, we answer up to 3 subparts at a time.…
Q: Question 1 government purchases are 2000. Desired consumption and desired investment are as follows:…
A: Given: Real money demand function: L(Y,r+πe)=0.01Yr+πe
Q: QUESTION 4 Consider the model of money demand we saw in class. Let the elasticity of money demand…
A: The elasticity of demand refers to the degree of responsiveness with respect to change in price
Q: The relationship between interest rate and Money supply is ____ Select one: a. Positive b.…
A: The money supply refers to all of a country's currency and other liquid assets on the measurement…
Q: Consider the following equations for the IS-LM framework. C = 100 + 0.8(1 – t)Y (consumption) - I =…
A: S curve equation : LM curve equation :
Q: Applied Problems on Monetary Policy and Interest Rates 1. For each of the following questions, draw…
A: In the Keynesian macroeconomic theory, the equilibrium interest rate in the money market is…
Q: You are given the following information: Money demand for transaction (Mdt) = 0.2Y…
A: Interest rate is determined in the market when money demand is equal to money supply Md= Ms
Q: Practice Use a money demand and supply diagram to show and explain what will happen to interest rate…
A: The money demand curve shows the inverse relationship between the interest rate and the quantity of…
Q: u10. Using the demand and supply schedule for money shown below, do the following: a)Graph the…
A: The LM curve shows the relation between the interest rate and the quantity of money which is…
Q: Advanced analysis) Assume the equation for the total demand for money is L= 0.4Y+80-4i, where L is…
A: Total demand for money is L= 0.4Y+80-4i Y=4450 i=5 Demand for money is directly related to the GDP…
Q: Consider the model of money demand we saw in class. Let the elasticity of money demand with respect…
A: We need to refer to the demand for money in the LM equation. MDP = kY - hi Here, the left-hand side…
Q: Q#2: (i) Find the level of income Y and the rate of interest i that simultaneously bring equilibrium…
A: The above model is of ISLM, where the product market and the money market holds simultaneously and…
Q: Q.1.The ________ demand for money arises out of the need to hold money as a medium of exchange. This…
A: NOTE: Money is a medium of exchange, store of value and unit of account.
Q: Assume that the following data characterize a hypothetical economy: money supply = $100 billion;…
A: Given: Under the hypothetical economy, the given money supply = $100 billion Quantity of money…
Q: What is the basic determinant of ( a ) the transactions demand and (b) the asset demand for money?…
A: a) The basic determinant of the transaction demand of money is the nominal GDP level. The more will…
Q: instructions: tackle question b only A. Given that in an economy, Given that in an economy, C =…
A: Answer: (B) Note: in the given question the import and export function has been interchanged so I…
Q: Suppose that the nominal interest rate is zero; that is, R = 0 . (a) What is the equilibrium…
A: Given; The nominal interest rate is zero; R=0 a) The inflation rate is equal to the real interest…
Q: 4) Use the functions below to find the equilibrium interest and the equilibrium quantity of money in…
A: The equilibrium interest rate is the rate at which the quantity of money demanded is equal to the…
Q: Answer the question based on the following information: For transactions, households and businesses…
A: Transaction demand for money is equal to the one-half of the nominal GDP. Nominal GDP is $300 So,…
Q: The demand for money is given by Md = $Y (0.3 - i), where $Y = 100 and the supply of money is $20.…
A: Demand for money indicates the amount of financial assets that the individuals desire to hold in the…
Q: If Susan Kalanti deposits 400,000 USD into a saving account at CITIBANK, and you know that CITIBANK,…
A: Given: The amount deposited (monetary base)=$400000 Maximum loan =84% of the amount deposited
Trending now
This is a popular solution!
Step by step
Solved in 3 steps
- A firm experienced the demand shown in the following table. *Unkown future value to be forecast Fill in the table by preparing forecasts based on a five-year moving average, a three-year moving average, and exponential smoothing (with a w=0.9 and a w=0.3). Note The exponential smoothing forecasts may be begun by assuming Y t+1=Yt. Using the forecasts from 2005 through 2009, compare the accuracy of each of the forecasting methods based on the RMSE criterion. Which forecast would you have used for 2010? Why?In this problem annual income for ages 20 to 80 is given graphically. People sometimes spend less than their income (to save for retirement) or more than their income (taking out a loan). The process of spreading out spending over a lifetime is called consumption smoothing. annual income ($10nns nar vaar) years) (a) Find the average annual income for these years. The average annual income is dollars/year. eTextbook and Media (b) Assuming that people spend at a constant rate equal to their average income, when are they spending less than they earn, and when are they spending more? Enter your answers in increasing order. They spend less than their income every year from age to They spend more than their income every year from age to and from age tohello i just wanna know if my answer to this question is correct or wrong: Consider five years of monthly pro fit for a company C) Discuss whether a simple exponential smoothing model works well with this data or not. Month Sales Jan-16 747 Feb-16 697 Mar-16 1014 Apr-16 1126 May-16 1105 Jun-16 1450 Jul-16 1639 Aug-16 1711 Sep-16 1307 Oct-16 1223 Nov-16 975 Dec-16 953 Jan-17 1024 Feb-17 928 Mar-17 1442 Apr-17 1371 May-17 1536 Jun-17 2004 Jul-17 1854 Aug-17 1951 Sep-17 1516 Oct-17 1642 Nov-17 1166 Dec-17 1106 Jan-18 1189 Feb-18 1209 Mar-18 1754 Apr-18 1843 May-18 1769 Jun-18 2207 Jul-18 2471 Aug-18 2288 Sep-18 1867 Oct-18 1980 Nov-18 1418 Dec-18 1333 Jan-19 1333 Feb-19 1370 Mar-19 2142 Apr-19 2138 May-19 2078 Jun-19 2960 Jul-19 2616 Aug-19 2861 Sep-19 2237 Oct-19 2225 Nov-19 1590 Dec-19 1659 Jan-20 1613 Feb-20 1605 Mar-20 2349 Apr-20 2468 May-20 2532 Jun-20 3127 Jul-20 3288 Aug-20 3285 Sep-20 2485 Oct-20 2723 Nov-20 1835 Dec-20 1894 here is my answer: Assessing the Applicability of…
- Metropolitan Hospital has estimated its average monthly bed needs asN = 1;000 + 9Xwhere X = time period (months); January 2002 = 0N = monthly bed needsAssume that no new hospital additions are expected in the area in the foreseeable future. The following monthly seasonal adjustment factors have been estimated, using data from the past five years:MONTH ADJUSTMENT FACTOR (%)January +5April −15July +4November −5December −25a. Forecast Metropolitan’s bed demand for January, April, July, November, and December 2007.b. If the following actual and forecast values for June bed demands have been recorded, what seasonal adjustment factor would you recommend be used in making future June forecasts?YEAR FORECAST ACTUAL2007 1,045 1,0962006 937…Please tell me what are the correct awnser for the following questions 11)12) they are multiple choice and unrelated questions to each other please tell me only which ones are correct Thank you Please see the attached picture has the graph which needs to be analysed to awnser question 12. 11 The UK GDP per capita measures: Select one or more: a. the total output of London’s economy. b. the average disposable income of a UK national. c. the total output of the UK nationals, divided by the number of the nationals. d. the total output of the UK’s economy, divided by the country’s population. 12 Look at this graph of real wage index in England between 1260 and 1800. Consider also that, in the bubonic plague of 1348 and 1351, between one quarter and one third of Europe’s population died. (SEE ATTACHED PICTURE) Select one or more: a. According to the Malthusian model, the fall in the population due to the bubonic plague would have led to an increase in the average…Please refer to the table “Pet Owners’ Behavior during Recession,” which shows results of a survey in themidst of the recession in 2008. Now that there hasbeen some economic recovery, the results may differ.a. Perform a survey of modern-day pet ownersasking the same questions. Compare andcontrast your results with those from 2008.b. Record the generation for your respondents andperform a cross-tab analysis based on those data.c. Record household life-cycle stage and perform across-tab analysis based on those data.
- A farmer believes there is an equal chance that the next growing season will be abnormallyrainy. His expected return function has the formExpected return = 0.5lnYNR + 0.5lnYRwhere YNR and YR represent the farmer’s income in the states of “normal rain”and “rainy,” respectively.Suppose the farmer must choose between two crops that promise the following incomeprospects:Crop YNR YRMaize $14,000 $5,000Cotton $9,500 $7,500a) Which of the crops will he plant?b) Suppose the farmer can plant half his field with each crop. Would he choose to do so?Explain your result.c) What mix of Maize and Cotton would provide maximum expected utility to this farmer?d) Would Maize crop insurance, available to farmers who grow only Maize, which costs$2,000 and pays off $4,000 in the event of a rainy growing season, cause this farmer tochange what he plants?Give each and every part answer plsActual sales of TV's for the first six month in 2021 were as follows:January 60 February 80 March 42April 68 May 44 June 72 Use this information and determine in whole numbers: 1 The average actual monthly sales for that period 2 Trends: Reduce this average by 6% per month for the next three months 3 Simple Moving Average (SMA): make a forecast for July using a three months simple movingaverage. 4 Weighted Moving Average (WMA): make forecast for July, using a three months weightedmoving average where the weights are 0.5; 0.3 and 0.2 respectively.
- 8) Why is the asnwer: B)? 9) Why is the answer: D)? 10) Why is the answer: D? what solutions do I need to find these answers? Asap plzQ: Determine whether the following statemnts are true or false: a) If the firm increases the volume of used resources by 30%, and the volume of production thus increases by 20%, then there is a positive effect of the production scale. b) Average fixed costs decrease as production increases. c) The economic profit usually exceeds the accounting profit.Pls help ASAP on this question (52)