Regressin Stal Multiple R R Square Adjusted R Square Standard Eror Observations 0.93943 0.88252 0.87752 3.98350 50,00000 Signif F 0.00000 ANOVA MS df 176.53718 Regression Residual 2.00000 47.00000 49.00000 5602.68991 745.81009 2801.34495 15.86830 Total 6348.50000 Standard Error Upper 95% Coefficients P-value Lower 95% Intercept DiscountCoupon(%) t Stat 6.58202 11.87277 101.61045 2.80821 77.82414 0.00000 54.03783 11.82375 2.40133 0.20226 0.00000 1.99444 CompAdExp($) 0.02560 0.00497 3.a. Fully interpret the coefficient of determination (R) 0.01026 0.48478 0.63009 -0.01566 level, Show all codel have significant explanatory power? Test the significance of the overall regression at the .01 3.c. Fully interpret the regression slope coefficients
Regressin Stal Multiple R R Square Adjusted R Square Standard Eror Observations 0.93943 0.88252 0.87752 3.98350 50,00000 Signif F 0.00000 ANOVA MS df 176.53718 Regression Residual 2.00000 47.00000 49.00000 5602.68991 745.81009 2801.34495 15.86830 Total 6348.50000 Standard Error Upper 95% Coefficients P-value Lower 95% Intercept DiscountCoupon(%) t Stat 6.58202 11.87277 101.61045 2.80821 77.82414 0.00000 54.03783 11.82375 2.40133 0.20226 0.00000 1.99444 CompAdExp($) 0.02560 0.00497 3.a. Fully interpret the coefficient of determination (R) 0.01026 0.48478 0.63009 -0.01566 level, Show all codel have significant explanatory power? Test the significance of the overall regression at the .01 3.c. Fully interpret the regression slope coefficients

MATLAB: An Introduction with Applications
6th Edition
ISBN:9781119256830
Author:Amos Gilat
Publisher:Amos Gilat
Chapter1: Starting With Matlab
Section: Chapter Questions
Problem 1P

Related questions
Topic Video
Question
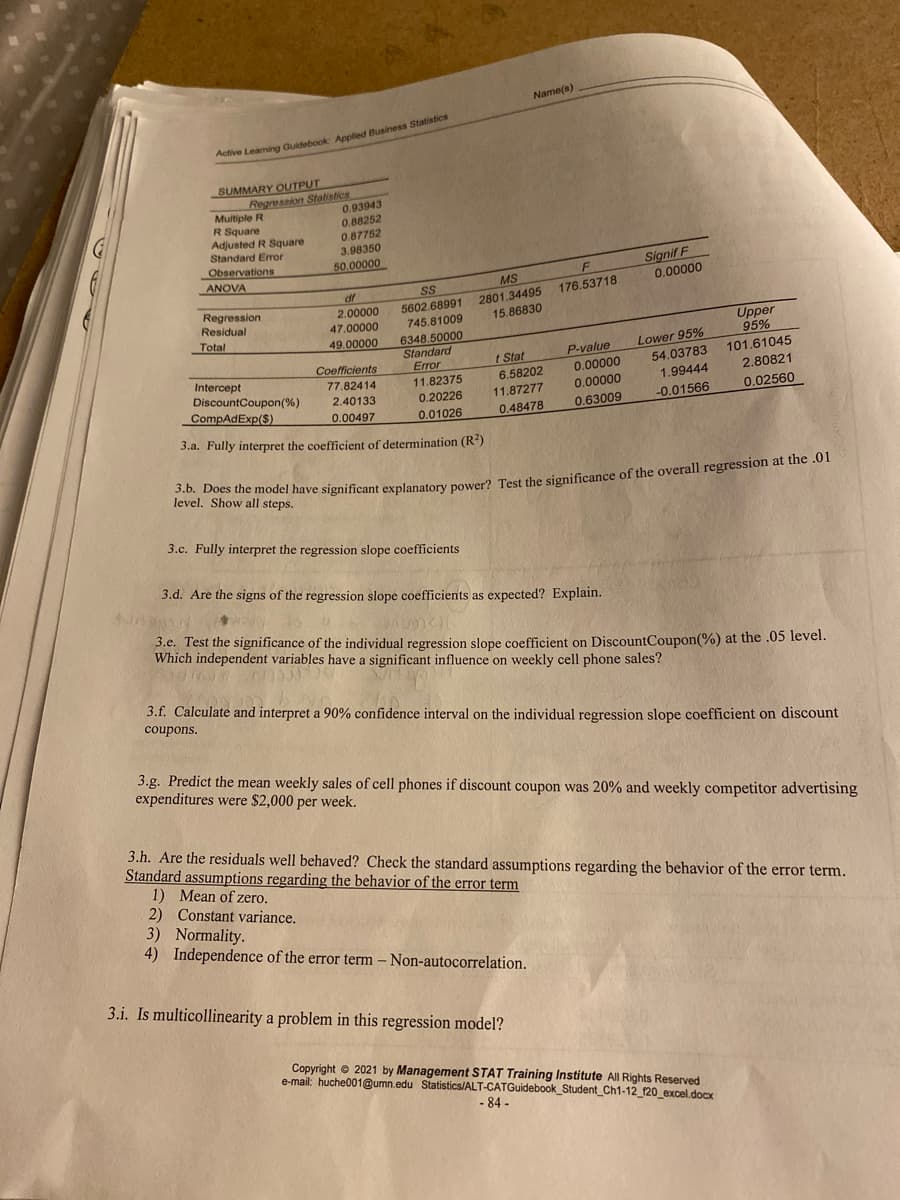
Transcribed Image Text:Name(s)
Active Leaming Guidebook: Agpled Business Statistics
SUMMARY OUTPUT
Multiple R
R Square
Adjusted R Square
Standard Eror
Regression Statistics
0.93943
0.88252
0.87752
3.98350
50,00000
Observations
Signif F
0.00000
ANOVA
F
MS
SS
df
2.00000
47.00000
176.53718
2801.34495
15.86830
Regression
5602.68991
745.81009
Residual
Total
Upper
6348.50000
Standard
Error
11.82375
49.00000
95%
P-value
Lower 95%
t Stat
6.58202
Coefficients
101.61045
54.03783
Intercept
DiscountCoupon(%)
CompAdExp($)
77.82414
0,00000
2.80821
0.00000
0.63009
1.99444
2.40133
0.20226
11.87277
-0.01566
0.02560
0.00497
0.01026
0.48478
3.a. Fully interpret the coefficient of determination (R?)
level. Show all codel have significant explanatory power? Test the significance of the overall regression at the .01
3.c. Fully interpret the regression slope coefficients
3.d. Are the signs of the regression slope coefficients as expected? Explain.
3.e. Test the significance of the individual regression slope coefficient on DiscountCoupon(%) at the .05 level.
Which independent variables have a significant influence on weekly cell phone sales?
3.f. Calculate and interpret a 90% confidence interval on the individual regression slope coefficient on discount
coupons.
3.g. Predict the mean weekly sales of cell phones if discount coupon was 20% and weekly competitor advertising
expenditures were $2,000 per week.
3.h. Are the residuals well behaved? Check the standard assumptions regarding the behavior of the error term.
Standard assumptions regarding the behavior of the error term
1) Mean of zero.
2) Constant variance.
3) Normality.
4) Independence of the error term – Non-autocorrelation.
3.i. Is multicollinearity a problem in this regression model?
Copyright © 2021 by Management STAT Training Institute All Rights Reserved
e-mail: huche001@umn.edu Statistics/ALT-CATGuidebook_Student_Ch1-12 120 excel.docx
- 84 -
Expert Solution
This question has been solved!
Explore an expertly crafted, step-by-step solution for a thorough understanding of key concepts.

This is a popular solution!

Trending now
This is a popular solution!

Step by step
Solved in 4 steps with 1 images

Knowledge Booster


Learn more about
Need a deep-dive on the concept behind this application? Look no further. Learn more about this topic, statistics and related others by exploring similar questions and additional content below.Recommended textbooks for you
MATLAB: An Introduction with Applications
Statistics
ISBN:
9781119256830
Author:
Amos Gilat
Publisher:
John Wiley & Sons Inc

Probability and Statistics for Engineering and th…
Statistics
ISBN:
9781305251809
Author:
Jay L. Devore
Publisher:
Cengage Learning

Statistics for The Behavioral Sciences (MindTap C…
Statistics
ISBN:
9781305504912
Author:
Frederick J Gravetter, Larry B. Wallnau
Publisher:
Cengage Learning
MATLAB: An Introduction with Applications
Statistics
ISBN:
9781119256830
Author:
Amos Gilat
Publisher:
John Wiley & Sons Inc
Probability and Statistics for Engineering and th…
Statistics
ISBN:
9781305251809
Author:
Jay L. Devore
Publisher:
Cengage Learning
Statistics for The Behavioral Sciences (MindTap C…
Statistics
ISBN:
9781305504912
Author:
Frederick J Gravetter, Larry B. Wallnau
Publisher:
Cengage Learning

Elementary Statistics: Picturing the World (7th E…
Statistics
ISBN:
9780134683416
Author:
Ron Larson, Betsy Farber
Publisher:
PEARSON

The Basic Practice of Statistics
Statistics
ISBN:
9781319042578
Author:
David S. Moore, William I. Notz, Michael A. Fligner
Publisher:
W. H. Freeman

Introduction to the Practice of Statistics
Statistics
ISBN:
9781319013387
Author:
David S. Moore, George P. McCabe, Bruce A. Craig
Publisher:
W. H. Freeman