Required: 1. Complete the below table to calculate each year's current ratio.

Accounting (Text Only)
26th Edition
ISBN:9781285743615
Author:Carl Warren, James M. Reeve, Jonathan Duchac
Publisher:Carl Warren, James M. Reeve, Jonathan Duchac
Chapter17: Financial Statement Analysis
Section: Chapter Questions
Problem 17.3CP: Vertical analysis The condensed income statements through income from operations for Dell Inc. and...

Related questions
Question
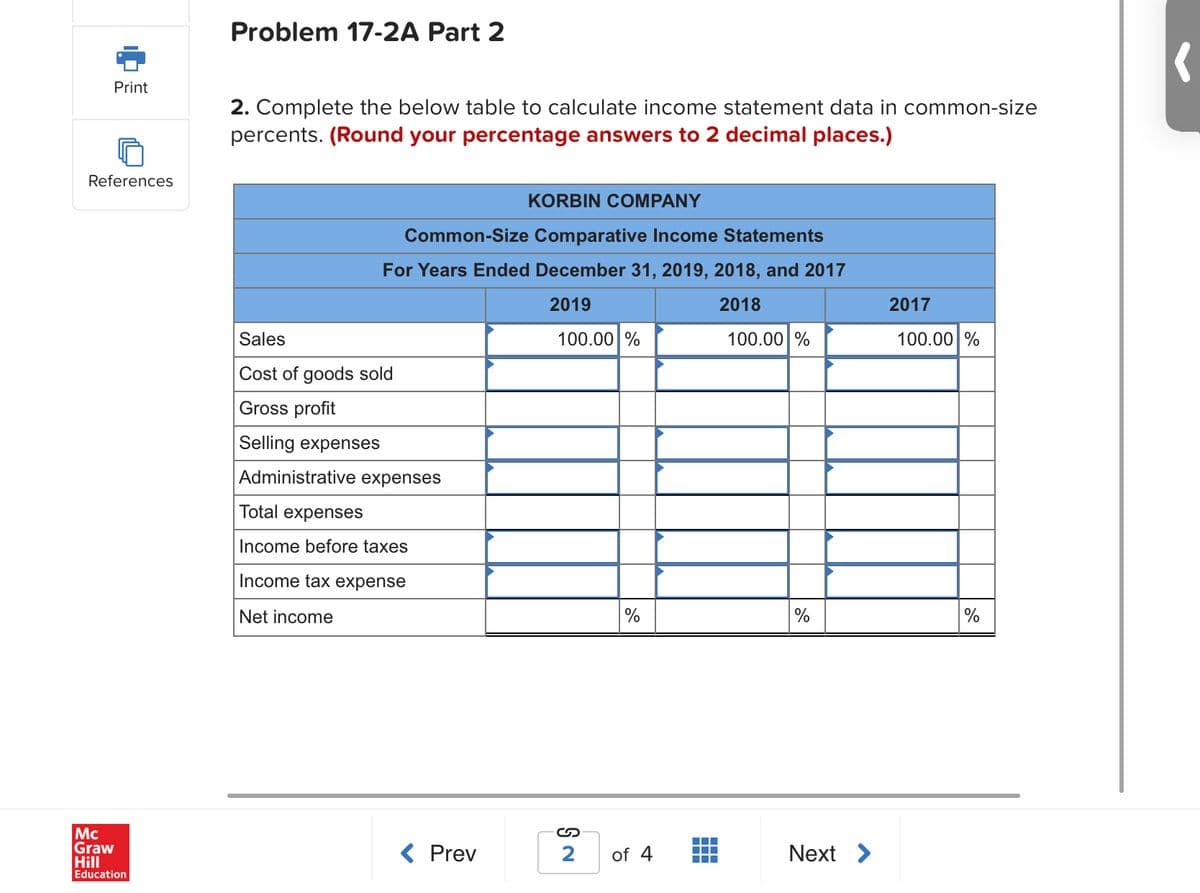
Transcribed Image Text:Problem 17-2A Part 2
Print
2. Complete the below table to calculate income statement data in common-size
percents. (Round your percentage answers to 2 decimal places.)
References
KORBIN COMPANY
Common-Size Comparative Income Statements
For Years Ended December 31, 2019, 2018, and 2017
2019
2018
2017
Sales
100.00 %
100.00 %
100.00 %
Cost of goods sold
Gross profit
Selling expenses
Administrative expenses
Total expenses
Income before taxes
Income tax expense
Net income
%
Mc
Graw
Hill
Education
< Prev
2
of 4
Next >
![PM Sat Mar 6
Done <
>
AA
A ezto.mheducation.com
Ch 17 - Connect Assignment i
Saved
Help
Save & Exit
Submit
Check my work
1
Required information
Problem 17-2A Ratios, common-size statements, and trend
Part 1 of 2
percents LO P1, P2, P3
[The following information applies to the questions displayed below.]
25
Selected comparative financial statements of Korbin Company follow.
points
KORBIN COMPANY
Comparative Income Statements
For Years Ended December 31, 2019, 2018, and 2017
2019
2018
2017
еВook
$ 401,594 $307,654
192,899
114,755
42,456
27,074
69,530
45,225
9,271
Sales
$213,500
241,760
159,834
Cost of goods sold
Gross profit
Selling expenses
Administrative expenses
136,640
76,860
28,182
57,026
36,143
93,169
66,665
12,400
Ask
17,721
45,903
30,957
6,284
Total expenses
Income before taxes
Print
Income tax expense
Net income
$ 54,265
$ 35,954 $ 24,673
References
KORBIN COMPANY
Comparative Balance Sheets
December 31, 2019, 2018, and 2017
2019
2018
2017
Assets
$ 59,658
$ 39,929
$ 53,376
3,870
62,458
Current assets
Long-term investments
Plant assets, net
900
114, 272
$ 173,930
103,654
$ 144,483
Total assets
$119,704
Liabilities and Equity
$ 25,394
73,000
9,125
66,411
$ 21,528
73,000
9,125
40,830
$ 20,948
55,000
6,11
37,645
Current liabilities
Common stock
Other paid-in capital
Retained earnings
Total liabilities and equity
$ 173,930
$ 144,483
$119,704
Problem 17-2A Part 1
Required:
1. Complete the below table to calculate each year's current ratio.
Mc
Graw
Hill
< Prev
1
of 4
Next >
Education](/v2/_next/image?url=https%3A%2F%2Fcontent.bartleby.com%2Fqna-images%2Fquestion%2Fc04a68db-c5db-40bc-94cf-7f74c56f8506%2F464f06ef-60db-4ca1-851d-0ccc33bd1c0a%2Fgdcqh2u_processed.jpeg&w=3840&q=75)
Transcribed Image Text:PM Sat Mar 6
Done <
>
AA
A ezto.mheducation.com
Ch 17 - Connect Assignment i
Saved
Help
Save & Exit
Submit
Check my work
1
Required information
Problem 17-2A Ratios, common-size statements, and trend
Part 1 of 2
percents LO P1, P2, P3
[The following information applies to the questions displayed below.]
25
Selected comparative financial statements of Korbin Company follow.
points
KORBIN COMPANY
Comparative Income Statements
For Years Ended December 31, 2019, 2018, and 2017
2019
2018
2017
еВook
$ 401,594 $307,654
192,899
114,755
42,456
27,074
69,530
45,225
9,271
Sales
$213,500
241,760
159,834
Cost of goods sold
Gross profit
Selling expenses
Administrative expenses
136,640
76,860
28,182
57,026
36,143
93,169
66,665
12,400
Ask
17,721
45,903
30,957
6,284
Total expenses
Income before taxes
Print
Income tax expense
Net income
$ 54,265
$ 35,954 $ 24,673
References
KORBIN COMPANY
Comparative Balance Sheets
December 31, 2019, 2018, and 2017
2019
2018
2017
Assets
$ 59,658
$ 39,929
$ 53,376
3,870
62,458
Current assets
Long-term investments
Plant assets, net
900
114, 272
$ 173,930
103,654
$ 144,483
Total assets
$119,704
Liabilities and Equity
$ 25,394
73,000
9,125
66,411
$ 21,528
73,000
9,125
40,830
$ 20,948
55,000
6,11
37,645
Current liabilities
Common stock
Other paid-in capital
Retained earnings
Total liabilities and equity
$ 173,930
$ 144,483
$119,704
Problem 17-2A Part 1
Required:
1. Complete the below table to calculate each year's current ratio.
Mc
Graw
Hill
< Prev
1
of 4
Next >
Education
Expert Solution
This question has been solved!
Explore an expertly crafted, step-by-step solution for a thorough understanding of key concepts.

This is a popular solution!

Trending now
This is a popular solution!

Step by step
Solved in 3 steps with 1 images

Knowledge Booster


Learn more about
Need a deep-dive on the concept behind this application? Look no further. Learn more about this topic, accounting and related others by exploring similar questions and additional content below.Recommended textbooks for you
Accounting (Text Only)
Accounting
ISBN:
9781285743615
Author:
Carl Warren, James M. Reeve, Jonathan Duchac
Publisher:
Cengage Learning

Survey of Accounting (Accounting I)
Accounting
ISBN:
9781305961883
Author:
Carl Warren
Publisher:
Cengage Learning

College Accounting, Chapters 1-27
Accounting
ISBN:
9781337794756
Author:
HEINTZ, James A.
Publisher:
Cengage Learning,
Accounting (Text Only)
Accounting
ISBN:
9781285743615
Author:
Carl Warren, James M. Reeve, Jonathan Duchac
Publisher:
Cengage Learning
Survey of Accounting (Accounting I)
Accounting
ISBN:
9781305961883
Author:
Carl Warren
Publisher:
Cengage Learning
College Accounting, Chapters 1-27
Accounting
ISBN:
9781337794756
Author:
HEINTZ, James A.
Publisher:
Cengage Learning,

Financial & Managerial Accounting
Accounting
ISBN:
9781285866307
Author:
Carl Warren, James M. Reeve, Jonathan Duchac
Publisher:
Cengage Learning

College Accounting, Chapters 1-27 (New in Account…
Accounting
ISBN:
9781305666160
Author:
James A. Heintz, Robert W. Parry
Publisher:
Cengage Learning