Complete a schedule that reflects a ratio analysis of (2017,2018,2019,2020 ). Compute the ratios discussed in the chapter.(Profitability, Activity Ratios, Tests of Liquidity, Tests of Solvency and Market Tests ? 2-Based on the data given, prepare a comparative written evaluation of the ratio analyses (and any other available information) and give your recommended choice with the supporting explanation.
Complete a schedule that reflects a ratio analysis of (2017,2018,2019,2020 ). Compute the ratios discussed in the chapter.(Profitability, Activity Ratios, Tests of Liquidity, Tests of Solvency and Market Tests ? 2-Based on the data given, prepare a comparative written evaluation of the ratio analyses (and any other available information) and give your recommended choice with the supporting explanation.

Fundamentals of Financial Management (MindTap Course List)
15th Edition
ISBN:9781337395250
Author:Eugene F. Brigham, Joel F. Houston
Publisher:Eugene F. Brigham, Joel F. Houston
Chapter4: Analysis Of Financial Statements
Section: Chapter Questions
Problem 24P: Income Statement for Year Ended December 31, 2018 (Millions of Dollars) Net sales 795.0 Cost of...

Related questions
Question
1- Complete a schedule that reflects a ratio analysis of (2017,2018,2019,2020 ). Compute the ratios discussed in
the chapter.(Profitability, Activity Ratios, Tests of Liquidity, Tests of Solvency and Market Tests ?
2-Based on the data given,
prepare a comparative written evaluation of the ratio analyses (and any other available information)
and give your recommended choice with the supporting explanation.
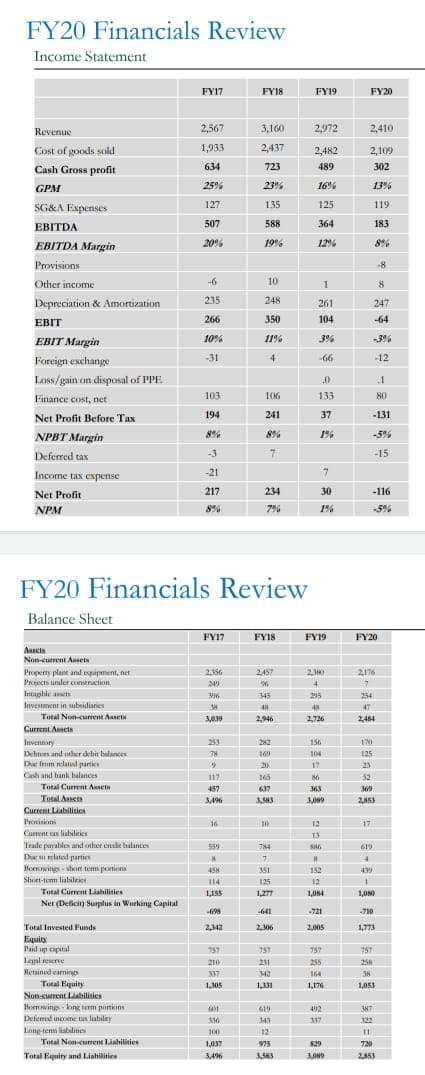
Transcribed Image Text:FY20 Financials Review
Income Statement
FY17
FY18
FY19
FY20
Revenue
2,567
3,160
2,972
2,410
Cost of goods sold
1,933
2,437
2,482
2,109
Cash Gross profit
634
723
489
302
GPM
25%
23%
16%
13%
127
135
125
119
SG&A Expenses
507
588
364
183
EBITDA
EBITDA Margin
20%
19%
12%
8%
Provisions
-8
Other income
-6
10
8
235
248
Depreciation & Amortization
261
247
266
350
104
-64
EBIT
EBIT Margin
10%
11%
3%
-3%
-31
4
66
-12
Foreign exchange
Loss/gain on disposal of PPE
Finance cost, net
103
106
133
80
Net Profit Before Tax
194
241
37
-131
NPBT Margin
8%
8%
1%
-5%
Deferred tax
-3
-15
Income tax expense
-21
Net Profit
217
234
30
-116
NPM
8%
7%
1%
-5%
FY20 Financials Review
Balance Sheet
FY17
FYIS
FY19
FY20
Aascta
Non-curent Ansets
Propeny plant and espipment, net
Projects under conieruction
Intaghle as
Investment in ubnidianes
2156
2457
230
2176
249
4.
45
215
254
47
Total Non-curent Asset
3,039
2946
2726
244
Current Ancis
Inventory
253
156
170
Dehtors and uther dehit balances
Da from elated partics
169
104
125
17
21
Cash and hank halances
117
165
52
Total Current Ansetn
457
637
363
369
Total Asscts
3,496
3,009
Current Liabilities
Ienisions
16
12
17
Current an liabilities
13
Trade payalles and other credie halances
Dar related partien
Hoenwings - shon tem ponions
55
T84
619
7.
45H
152
439
Short-tem liahileic
114
125
12
Total Current Liabilities
L155
1,277
1,04
1,00
Net (Deficit) Surplus in Wurking Capital
4/98
-641
-721
710
Total Invested Funds
2,342
205
1,773
Equity
Pail up capital
Legal resene
Retained eamings
757
7S7
757
757
21
211
255
258
337
342
164
38
Total Equity
Non-curent Liabilitics
Homwings - kong term purtikins
Defemal income tas liabiley
Lang-tenn lablities
Total Non-curent Liahilities
1,305
131
1,176
1,053
410
412
343
17
100
12
1,037
975
829
720
Total Equity and Liabilities
3,496
3.583 109 2AS3
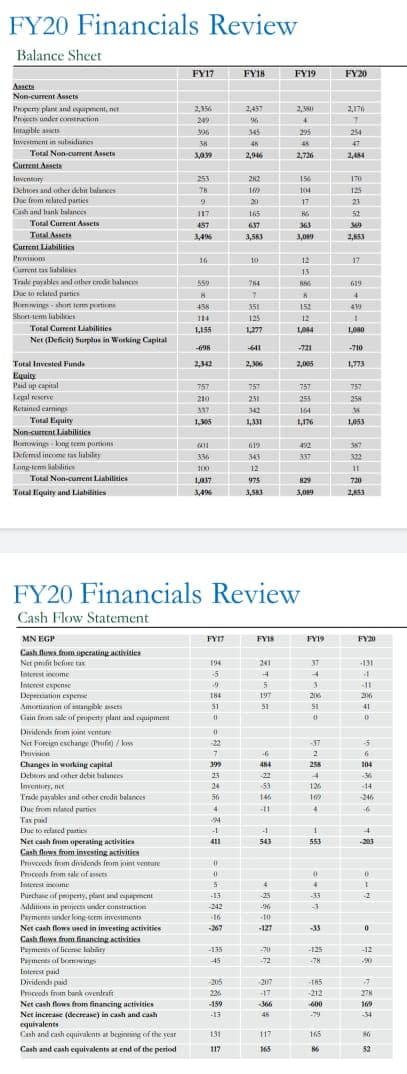
Transcribed Image Text:FY20 Financials Review
Balance Sheet
FY17
FY18
FY19
FY20
Ascta
Non-current Assets
I'rpeny plant and epipment, net
Peiects under cotraction
Intagble act
2,156
2437
2,176
249
345
205
254
Investment in subsidianes
47
Tutal Non-cunent Assets
2,946
2,726
2,44
Current Anseta
Inventury
253
212
156
170
Debtoes and other debit balances
78
16
104
125
Dae fmm elated panies
20
17
23
Cah and hank halances
117
165
52
Total Current Assets
457
637
363
Total Assets
3,46
3,563
3.089
2,853
Current Liabilities
Provision
16
10
12
17
Curment tas lishilities
Trale payables and other ede halances
Due n elated parties
Hornwing shut em pertion
Shoet-tem liabileies
13
559
619
456
351
153
4
114
125
12
Total Current Liahilisies
L155
1,277
LO4
1,080
Net (Deficit) Surplus in Working Capital
698
641
-721
-710
Tutal Invested Funde
2.342
2.306
2,005
1,773
Equity
Paid up capital
757
757
757
757
Legal reserve
210
251
255
258
Retained camings
337
342
164
35
Total Equiry
Nin current Liabilities
Bomwing kang tem portions
Defemud incme tas liabiley
1,05
1,31
1,176
L053
619
492
387
336
343
337
322
Lang-tenn lablitis
100
12
Total Non-cunent Liabilities
LA37
975
829
720
Total Equity and Liabilities
3.496
1.SKI 109 2.853
3,089
FY20 Financials Review
Cash Flow Statement
MN EGP
FYT
FYIS
FY19
FY20
Cash luwa fnm.upetating activities
Net pnifit hefore tax
194
241
37
-131
Interst income
5
Interest espense
Deperciation espeme
Amortization of itangble isets
Gain fnm sale of peiperty plant and espuipment
11
184
197
51
51
41
Dividends from jint venture
Net Forcign eschange (Pifi) / ko
Pruvnitn
-22
-37
-17
-5
2
Changes in working capital
199
484
258
104
Debeors und other debit hulances
23
22
-36
Imentuey, net
Trade payables and other credit balances
Due fnm nlaned parties
Tax pail
Due to rtated parties
24
53
126
-14
56
146
169
246
11
94
Net cash from operating activities
Cash flows from investing activitien
Pruveeds fom dividends fem jnint vennae
411
543
553
-203
Pruceods from sale of asses
Interrst ncome
Purchane of peiperty, plant and equpment
Additions in peuies under cunstruction
-13
-25
33
242
-3
Paymenes under long-term investments
-16
10
Net cash flows ed in investing activities
267
-127
-33
Cash flows fnm financing activities
Paymenes of lieme lahity
Payments of bomwings
-135
-125
-12
45
-72
-7H
Interest paid
Dividends paid
Pruceods from bank oventraft
Net cash flows from financing activities
Net increase (decrease) in cash and cash
equivalents
Cash and cash cquivaknts at beginning of the yoar
205
-207
-TH5
226
17
-212
27H
-159
366
-600
169
-13
-79
34
131
117
165
Cash and cash equivalents at end of the period
117
165
52
一
Expert Solution
This question has been solved!
Explore an expertly crafted, step-by-step solution for a thorough understanding of key concepts.

Step by step
Solved in 3 steps with 1 images

Knowledge Booster


Learn more about
Need a deep-dive on the concept behind this application? Look no further. Learn more about this topic, accounting and related others by exploring similar questions and additional content below.Recommended textbooks for you
Fundamentals of Financial Management (MindTap Cou…
Finance
ISBN:
9781337395250
Author:
Eugene F. Brigham, Joel F. Houston
Publisher:
Cengage Learning
Fundamentals of Financial Management (MindTap Cou…
Finance
ISBN:
9781337395250
Author:
Eugene F. Brigham, Joel F. Houston
Publisher:
Cengage Learning