Response rates for customer complaints by Companies A and B are observed for 8 consecutive days and are given below. Although they have similar response rates on average, one claim is that they are not equally consistent in responding to customer complaints. Assuming that both populations are Normal, check this claim by testing the hypothesis that o, =6, against the alternative that o, #6, at a = 0.05 significance level and by using the p-value approach. 0.47 0.41 0.41 0.53 0.38 0.48 0.53 0.54 (A) 0.38 0.38 0.39 0.41 0.38 0.38 0.39 0.39 (B) (a) The f value for the test can be computed as (Round to two decimal places including any zeros.) (b) The p-value is the total tail probability corresponding to the calculated test value, which is then compared to a. In a two-tailed test, this is 2P(F>f) or, in a right-tailed test, this is P(F>f). The p-value for the test can be calculated as (Round to four decimal places including any zeros.) (c) V the null hypothesis because there is evidence that o, 02.
Response rates for customer complaints by Companies A and B are observed for 8 consecutive days and are given below. Although they have similar response rates on average, one claim is that they are not equally consistent in responding to customer complaints. Assuming that both populations are Normal, check this claim by testing the hypothesis that o, =6, against the alternative that o, #6, at a = 0.05 significance level and by using the p-value approach. 0.47 0.41 0.41 0.53 0.38 0.48 0.53 0.54 (A) 0.38 0.38 0.39 0.41 0.38 0.38 0.39 0.39 (B) (a) The f value for the test can be computed as (Round to two decimal places including any zeros.) (b) The p-value is the total tail probability corresponding to the calculated test value, which is then compared to a. In a two-tailed test, this is 2P(F>f) or, in a right-tailed test, this is P(F>f). The p-value for the test can be calculated as (Round to four decimal places including any zeros.) (c) V the null hypothesis because there is evidence that o, 02.

MATLAB: An Introduction with Applications
6th Edition
ISBN:9781119256830
Author:Amos Gilat
Publisher:Amos Gilat
Chapter1: Starting With Matlab
Section: Chapter Questions
Problem 1P

Related questions
Question
100%
in part C, the blanks are:
blank 1: reject/ don't reject
blank 2: sufficient/ in sufficient
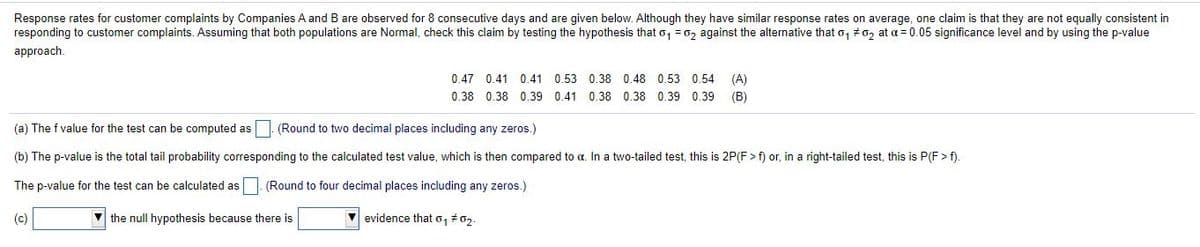
Transcribed Image Text:Response rates for customer complaints by Companies A and B are observed for 8 consecutive days and are given below. Although they have similar response rates on average, one claim is that they are not equally consistent in
responding to customer complaints. Assuming that both populations are Normal, check this claim by testing the hypothesis that o, =62 against the alternative that o, 62 at a = 0.05 significance level and by using the p-value
approach.
0.47 0.41 0.41 0.53 0.38 0.48 0.53 0.54
(A)
0.38 0.38 0.39 0.41 0.38 0.38 0.39 0.39
(B)
(a) The f value for the test can be computed as
(Round to two decimal places including any zeros.)
(b) The p-value is the total tail probability corresponding to the calculated test value, which is then compared to a. In a two-tailed test, this is 2P(F > f) or, in a right-tailed test, this is P(F > f).
The p-value for the test can be calculated as- (Round to four decimal places including any zeros.)
(c)
V the null hypothesis because there is
V evidence that o, 0,.
Expert Solution
This question has been solved!
Explore an expertly crafted, step-by-step solution for a thorough understanding of key concepts.

Step by step
Solved in 2 steps with 2 images

Knowledge Booster


Learn more about
Need a deep-dive on the concept behind this application? Look no further. Learn more about this topic, statistics and related others by exploring similar questions and additional content below.Recommended textbooks for you
MATLAB: An Introduction with Applications
Statistics
ISBN:
9781119256830
Author:
Amos Gilat
Publisher:
John Wiley & Sons Inc

Probability and Statistics for Engineering and th…
Statistics
ISBN:
9781305251809
Author:
Jay L. Devore
Publisher:
Cengage Learning

Statistics for The Behavioral Sciences (MindTap C…
Statistics
ISBN:
9781305504912
Author:
Frederick J Gravetter, Larry B. Wallnau
Publisher:
Cengage Learning
MATLAB: An Introduction with Applications
Statistics
ISBN:
9781119256830
Author:
Amos Gilat
Publisher:
John Wiley & Sons Inc
Probability and Statistics for Engineering and th…
Statistics
ISBN:
9781305251809
Author:
Jay L. Devore
Publisher:
Cengage Learning
Statistics for The Behavioral Sciences (MindTap C…
Statistics
ISBN:
9781305504912
Author:
Frederick J Gravetter, Larry B. Wallnau
Publisher:
Cengage Learning

Elementary Statistics: Picturing the World (7th E…
Statistics
ISBN:
9780134683416
Author:
Ron Larson, Betsy Farber
Publisher:
PEARSON

The Basic Practice of Statistics
Statistics
ISBN:
9781319042578
Author:
David S. Moore, William I. Notz, Michael A. Fligner
Publisher:
W. H. Freeman

Introduction to the Practice of Statistics
Statistics
ISBN:
9781319013387
Author:
David S. Moore, George P. McCabe, Bruce A. Craig
Publisher:
W. H. Freeman