
Biochemistry
6th Edition
ISBN:9781305577206
Author:Reginald H. Garrett, Charles M. Grisham
Publisher:Reginald H. Garrett, Charles M. Grisham
Chapter28: Dna Metabolism: Replication, Recombination, And Repair
Section: Chapter Questions
Problem 1P: Semiconservative or Conservative DNA Replication If 15N-Iabeled E. coli DNA has a density of 1.724...

Related questions
Question
Restriction mapping of the delta chromosome
I need help with question two please
Transcribed Image Text:H.
A E S
AE
AS
23,130 BP
9,416 BP
6,557 BP
4,361 BP
2,322 BP
2,027 BP
564 BP
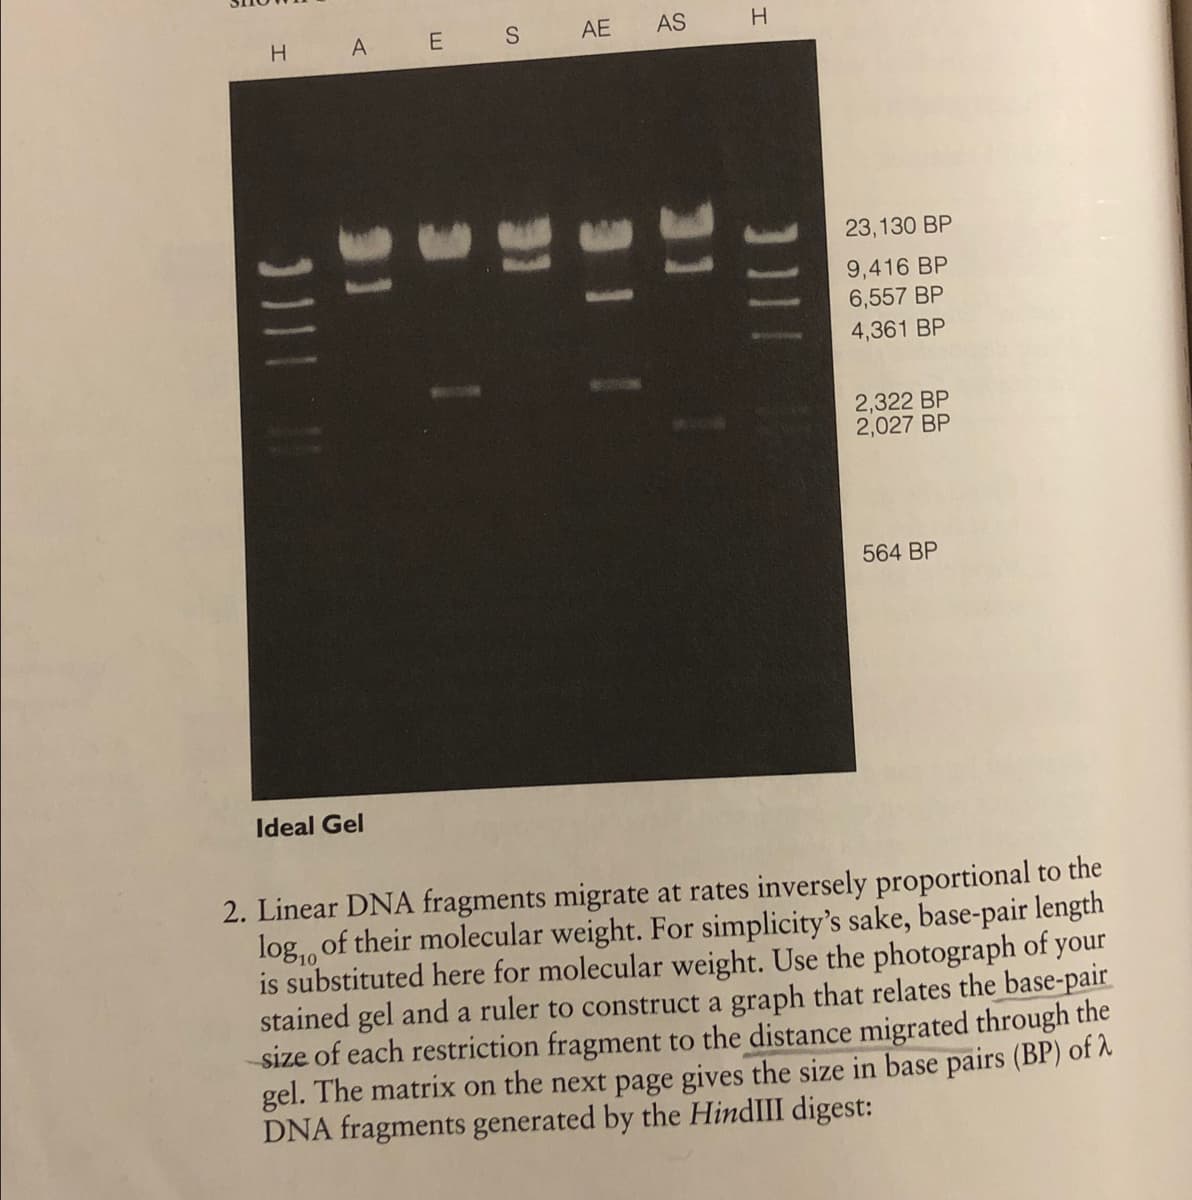
Ideal Gel
2. Linear DNA fragments migrate at rates inversely proportional to the
log,, of their molecular weight. For simplicity's sake, base-pair length
is substituted here for molecular weight. Use the photograph of your
stained gel and a ruler to construct a graph that relates the base-pair
size of each restriction fragment to the distance migrated through the
gel. The matrix on the next page gives the size in base pairs (BP) of A
DNA fragments generated by the HindIII digest:
11I
![the A Chromosome
Hindlll
Apal
BP
Ecoo1091
D
D
SnaBI
Apal/EcoO1091
Apal/SnaBI
BP
23,130
BP
D
BP
BP
ВР
D]
9,416
6,557
4,361
2,322
2,027
564
125*
.usually runs off the end of the mini-gel during electrophoresis
a. Orient your gel photo with the wells at the top, and locate one of
the two H lanes. Working from top to bottom, match the base-
pair sizes of the HindIII fragments with the bands that appear in
the H lane. Carefully measure the distance (in mm) that each
HindIII fragment migrated from the sample well. Measure from
the front edge of the well to the leading edge of each band. Enter
the distance migrated by each fragment into the D column.
b. Set up semilog graph paper using the distance migrated as the x
(arithmetic) axis and the base-pair length as the y (logarithmic)
axis. (The first cycle of the y axis should begin with 1,000 bp and
end with 10,000 bp–counting in 1,000-bp increments. The sec-
ond cycle begins with 10,000 bp and ends with 100,000 bp–
counting in 10,000 bp increments.) Then, plot the distance
migrated versus base-pair length for each HindIII fragment.
Finally, connect the data points.
c. Measure the distance migrated by the smallest Apal restriction
fragment, and locate this distance on the x axis of your graph.
Then, use a ruler to draw a vertical line from this point to its inter-
section with the HindIII data line. Now, extend a horizontal line
from this point to the y axis. This gives the bp size of the smallest
Apal fragment. Enter the result into the matrix above. Do not cal-
culate the length of the largest fragment at this time.
d. Repeat step c to calculate the bp sizes of the smallest restriction
fragments in the EcoO1091 and SnaBI single digests and the two
smallest fragments in the double digests. Enter the data into the
matrix above.
e. The gel does not provide an accurate determination of the sizes of
the largest fragments in each of the digests, because they are out-
side the linear resolving range of the gel. Therefore, determine the
length of the largest fragment in each digest by subtracting the
length(s) of the smaller fragment(s) from the length of the A
genome (48,502 base pairs). Enter the data into the matrix above.
3. Construct a restriction map of the cutting sites of 2 DNA, showing
the cutting sites for Apal, EcoO1091, and SnaBI.
a. The data from the single digests indicates how far each enzyme
cuts from the end of the 2 chromosome.](/v2/_next/image?url=https%3A%2F%2Fcontent.bartleby.com%2Fqna-images%2Fquestion%2Fc81a9b48-86e8-469d-8a58-0a2b670d7706%2F45c58c5d-708d-4589-8721-a6bb8e227ea3%2F044wn3j_processed.jpeg&w=3840&q=75)
Transcribed Image Text:the A Chromosome
Hindlll
Apal
BP
Ecoo1091
D
D
SnaBI
Apal/EcoO1091
Apal/SnaBI
BP
23,130
BP
D
BP
BP
ВР
D]
9,416
6,557
4,361
2,322
2,027
564
125*
.usually runs off the end of the mini-gel during electrophoresis
a. Orient your gel photo with the wells at the top, and locate one of
the two H lanes. Working from top to bottom, match the base-
pair sizes of the HindIII fragments with the bands that appear in
the H lane. Carefully measure the distance (in mm) that each
HindIII fragment migrated from the sample well. Measure from
the front edge of the well to the leading edge of each band. Enter
the distance migrated by each fragment into the D column.
b. Set up semilog graph paper using the distance migrated as the x
(arithmetic) axis and the base-pair length as the y (logarithmic)
axis. (The first cycle of the y axis should begin with 1,000 bp and
end with 10,000 bp–counting in 1,000-bp increments. The sec-
ond cycle begins with 10,000 bp and ends with 100,000 bp–
counting in 10,000 bp increments.) Then, plot the distance
migrated versus base-pair length for each HindIII fragment.
Finally, connect the data points.
c. Measure the distance migrated by the smallest Apal restriction
fragment, and locate this distance on the x axis of your graph.
Then, use a ruler to draw a vertical line from this point to its inter-
section with the HindIII data line. Now, extend a horizontal line
from this point to the y axis. This gives the bp size of the smallest
Apal fragment. Enter the result into the matrix above. Do not cal-
culate the length of the largest fragment at this time.
d. Repeat step c to calculate the bp sizes of the smallest restriction
fragments in the EcoO1091 and SnaBI single digests and the two
smallest fragments in the double digests. Enter the data into the
matrix above.
e. The gel does not provide an accurate determination of the sizes of
the largest fragments in each of the digests, because they are out-
side the linear resolving range of the gel. Therefore, determine the
length of the largest fragment in each digest by subtracting the
length(s) of the smaller fragment(s) from the length of the A
genome (48,502 base pairs). Enter the data into the matrix above.
3. Construct a restriction map of the cutting sites of 2 DNA, showing
the cutting sites for Apal, EcoO1091, and SnaBI.
a. The data from the single digests indicates how far each enzyme
cuts from the end of the 2 chromosome.
Expert Solution
This question has been solved!
Explore an expertly crafted, step-by-step solution for a thorough understanding of key concepts.

This is a popular solution!

Trending now
This is a popular solution!

Step by step
Solved in 2 steps with 3 images

Knowledge Booster


Learn more about
Need a deep-dive on the concept behind this application? Look no further. Learn more about this topic, biology and related others by exploring similar questions and additional content below.Recommended textbooks for you
Biochemistry
Biochemistry
ISBN:
9781305577206
Author:
Reginald H. Garrett, Charles M. Grisham
Publisher:
Cengage Learning
Biochemistry
Biochemistry
ISBN:
9781305577206
Author:
Reginald H. Garrett, Charles M. Grisham
Publisher:
Cengage Learning