Results from a survey five years ago asking where coffee drinkers typically drink their first cup of coffee were as follows: 8% while commuting, 17% at work, 70% at home, and 5% at a restaurant/coffee bar or other location. To determine whether this distribution has changed, you randomly select 581 coffee drinkers and ask each where they typically drink their first cup of coffee. Based on the results provided in the table, can you conclude that there has been a change in the claimed or expected distribution of locations? Use a = 0.05.
Results from a survey five years ago asking where coffee drinkers typically drink their first cup of coffee were as follows: 8% while commuting, 17% at work, 70% at home, and 5% at a restaurant/coffee bar or other location. To determine whether this distribution has changed, you randomly select 581 coffee drinkers and ask each where they typically drink their first cup of coffee. Based on the results provided in the table, can you conclude that there has been a change in the claimed or expected distribution of locations? Use a = 0.05.

Glencoe Algebra 1, Student Edition, 9780079039897, 0079039898, 2018
18th Edition
ISBN:9780079039897
Author:Carter
Publisher:Carter
Chapter10: Statistics
Section: Chapter Questions
Problem 13PT

Related questions
Question
Identify the null and alternative hypothesis, find the critical value and identify the rejection region, calculate chi-square, decide whether to accept or reject the null hypothesis, and write an APA format results statement.
Transcribed Image Text:ONE:
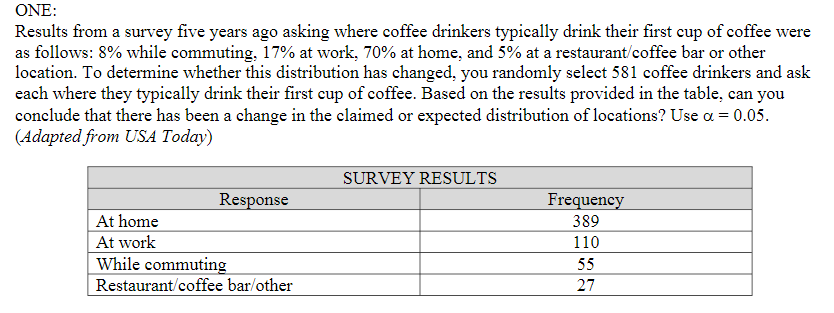
Results from a survey five years ago asking where coffee drinkers typically drink their first cup of coffee were
as follows: 8% while commuting, 17% at work, 70% at home, and 5% at a restaurant/coffee bar or other
location. To determine whether this distribution has changed, you randomly select 581 coffee drinkers and ask
each where they typically drink their first cup of coffee. Based on the results provided in the table, can you
conclude that there has been a change in the claimed or expected distribution of locations? Use a = 0.05.
(Adapted from USA Today)
SURVEY RESULTS
Response
Frequency
At home
389
At work
110
While commuting
Restaurant/coffee bar/other
55
27
Expert Solution
This question has been solved!
Explore an expertly crafted, step-by-step solution for a thorough understanding of key concepts.

This is a popular solution!

Trending now
This is a popular solution!

Step by step
Solved in 3 steps with 3 images

Knowledge Booster


Learn more about
Need a deep-dive on the concept behind this application? Look no further. Learn more about this topic, statistics and related others by exploring similar questions and additional content below.Recommended textbooks for you
Glencoe Algebra 1, Student Edition, 9780079039897…
Algebra
ISBN:
9780079039897
Author:
Carter
Publisher:
McGraw Hill

Holt Mcdougal Larson Pre-algebra: Student Edition…
Algebra
ISBN:
9780547587776
Author:
HOLT MCDOUGAL
Publisher:
HOLT MCDOUGAL
Glencoe Algebra 1, Student Edition, 9780079039897…
Algebra
ISBN:
9780079039897
Author:
Carter
Publisher:
McGraw Hill
Holt Mcdougal Larson Pre-algebra: Student Edition…
Algebra
ISBN:
9780547587776
Author:
HOLT MCDOUGAL
Publisher:
HOLT MCDOUGAL