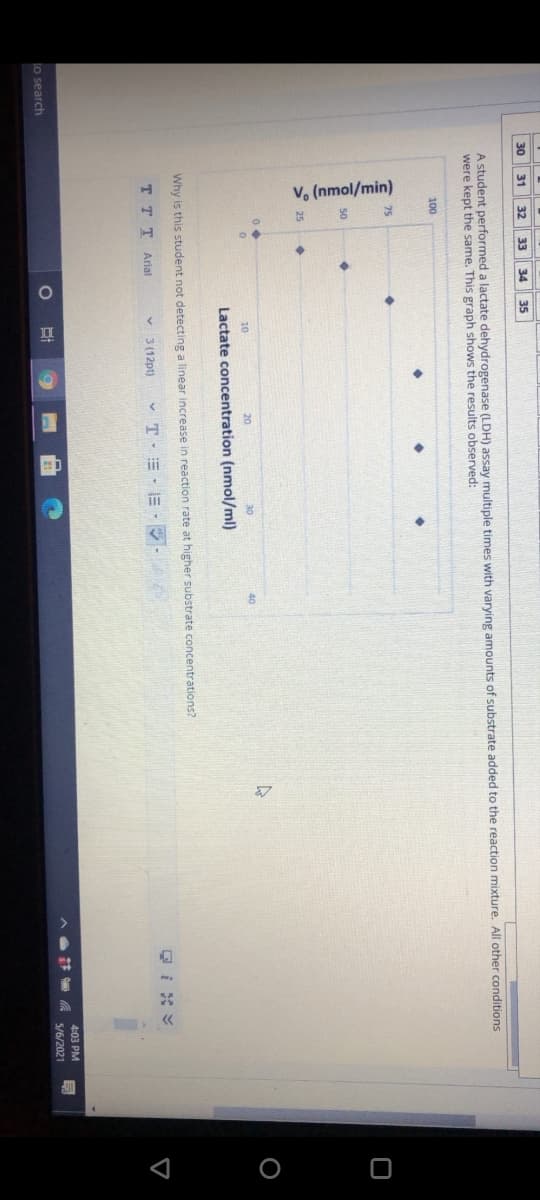
rformed a lactate dehydrogenase (LDH) assay multiple times e same. This graph shows the results observed: 10 20 30 Lactate concentration (nmol/ml) s student not detecting a linear increase in reaction rate at high T Arial v 3 (12pt) v T E - E -


DNA and RNA
Deoxyribonucleic acid (DNA) is usually called the blueprint of life. Deoxyribose is a monosaccharide that has a key function in the synthesis of deoxyribonucleic acid. One less oxygen-containing hydroxyl group occurs in deoxyribose sugar. Nucleic acid, deoxyribonucleic acid, is one of the natural components. Deoxyribonucleic acid is a double-stranded molecule. Watson and Crick postulated the double-stranded model of the helix. A deoxyribonucleic acid is a molecular group that carries and transmits genetic information from parents to offspring. All eukaryotic and prokaryotic cells are involved.
DNA as the Genetic Material
DNA, or deoxyribonucleic acid, is a long polymeric nucleic acid molecule discovered in the late 1930s. It is a polymer; a long chain-like molecule made up of several monomers connected in a sequence. It possesses certain characteristics that qualify it as a genetic component. Certain organisms have different types of nucleic acids as their genetic material - DNA or RNA.
Genetics
The significant branch in science which involves the study of genes, gene variations, and the organism's heredity is known as genetics. It is also used to study the involvement of a gene or set of genes in the health of an individual and how it prevents several diseases in a human being. Thus, genetics also creates an understanding of various medical conditions.
DNA Replication
The mechanism by which deoxyribonucleic acid (DNA) is capable of producing an exact copy of its own is defined as DNA replication. The DNA molecules utilize a semiconservative method for replication.

Step by step
Solved in 3 steps


