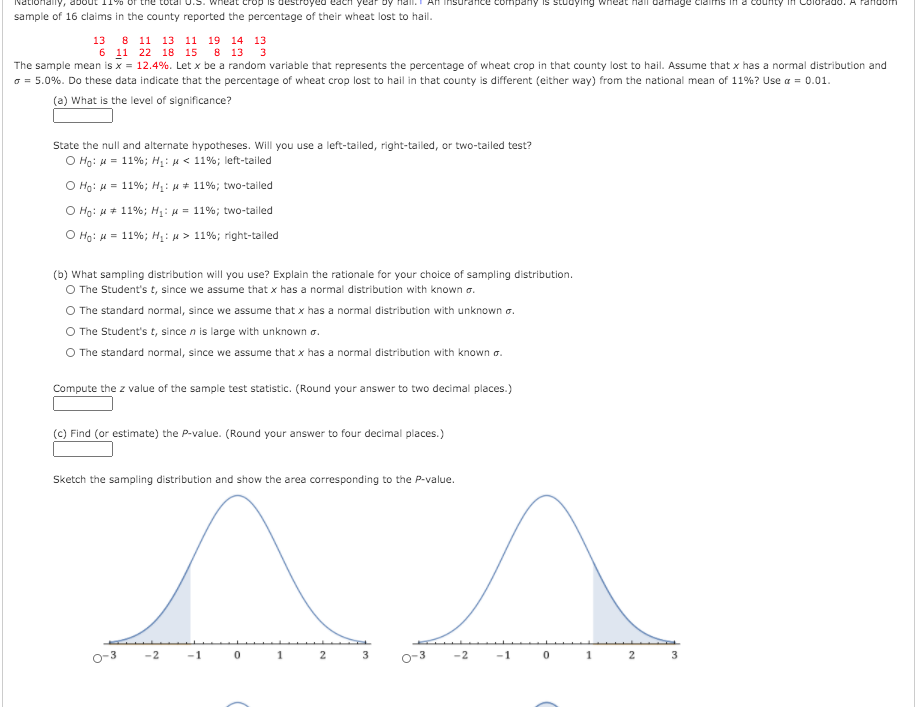
sample of 16 claims in the county reported the percentage of their wheat lost to hail. 13 8 11 13 11 19 14 13 6 11 22 18 15 8 13 3 The sample mean is x = 12.4%. Let x be a random variable that represents the percentage of wheat crop in that county lost to hail. Assume that x has a normal distribution and o = 5.0%. Do these data indicate that the percentage of wheat crop lost to hail in that county is different (either way) from the national mean of 11%? Use a = 0.01. (a) What is the level of significance? State the null and alternate hypotheses. Will you use a left-tailed, right-tailed, or two-tailed test? O Hg: = 11%; Hạ:u< 11%; left-tailed O Ho: H = 11%; H: u * 11%; two-tailed O Hg: H* 11%; H: u = 11%; two-tailed O Ha: t 11%: H 11%: rioht-tailed


Unitary Method
The word “unitary” comes from the word “unit”, which means a single and complete entity. In this method, we find the value of a unit product from the given number of products, and then we solve for the other number of products.
Speed, Time, and Distance
Imagine you and 3 of your friends are planning to go to the playground at 6 in the evening. Your house is one mile away from the playground and one of your friends named Jim must start at 5 pm to reach the playground by walk. The other two friends are 3 miles away.
Profit and Loss
The amount earned or lost on the sale of one or more items is referred to as the profit or loss on that item.
Units and Measurements
Measurements and comparisons are the foundation of science and engineering. We, therefore, need rules that tell us how things are measured and compared. For these measurements and comparisons, we perform certain experiments, and we will need the experiments to set up the devices.
Hi could fill out the blanks for me

Step by step
Solved in 2 steps with 3 images


