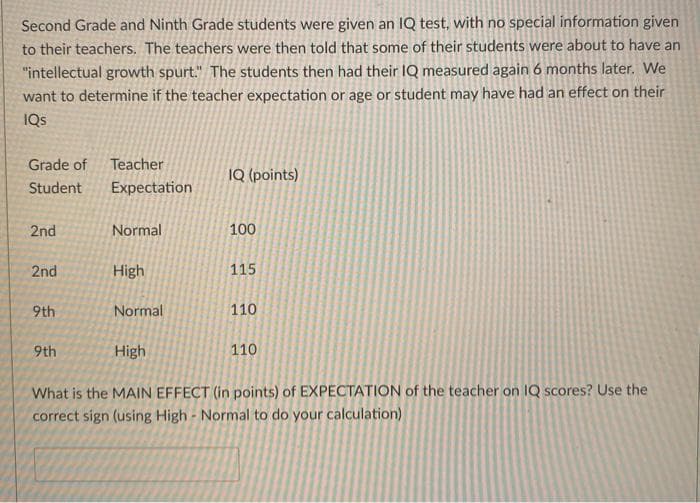
Second Grade and Ninth Grade students were given an IQ test, with no special information given to their teachers. The teachers were then told that some of their students were about to have an "intellectual growth spurt." The students then had their IQ measured again 6 months later. We want to determine if the teacher expectation or age or student may have had an effect on their IQs
Q: To what extent do data and information have an impact on one another?
A: A data can be raw or grouped, with some pro and cons associated with both of them. The raw data has…
Q: In a study of data derived from a variety of natural phenomena, F. A. Benford formulated an…
A: Answer : P(d<3)= P(d = 1,2) =0.301 + 0.176= 0.477
Q: (1) Do life expectancy and income appear to be associated or independent? (2) Has the relationship…
A: The scatter plot of variable income and life expectancy is given.
Q: Want to explain these outputs?
A: Normality test are used to measure the whether the population follows normal distribution or not. It…
Q: A medical doctor who had been working in the US states of Arizona and New Mexico moved to the state…
A: The results show that with an increase in latitude the mortality rate due to skin cancer reduces…
Q: In 1998 El Salvador had a gini index of 54.50 and 26 years later had a gini index of 38.
A:
Q: QUESTION 40 In the 1980s, a study linked coffee to a higher risk of heart disease and pancreatic…
A: In the studies , we are conducting , sometimes we are taking coffee as our research subject and…
Q: Toward the middle of the harvesting season, peaches for canning come in three types, early, late,…
A: Assume, E be the set representing the trucks carried early peaches and n(E) be the number of…
Q: 4. Assume the below life table was constructed from following individuals who were diagnosed with a…
A: The Survival probability for the time t+1 is defined using the Kaplan-Meir approach is given as:…
Q: QUESTION 40 In the 1980s, a study linked coffee to a higher risk of heart disease and pancreatic…
A: Given that,
Q: The hypothetical data in the table below displays the percentage that unemployment benefits replace…
A: The hypothetical data in the table shows the percentage that unemployment benefits replace take-home…
Q: Despite Progress - Millions Without Access to Education Number of out-of-school children worldwide…
A: Statistics are has two branches, they are descriptive and inferential statistic. Descriptive…
Q: Give at least three examples from economics where each of the following type of data can be used:…
A: Time series data of a variable have a set of observations on values at different points of time.…
Q: Which of the following time series forecasting methods would not be used to forecast seasonal data?
A:
Q: Question 27, problem in photo and information in second photo!
A: (a)The difference between before intervention and after intervention is tabulated below:
Q: A companies HR manager has noticed that they are not retaining their talent. The HR manager believes…
A:
Q: The researcher is interested in how people change on the personality dimension of neuroticism over…
A: a) Independent sample test is used when we have two sample and we are interested to compare the two…
Q: Despite Progress - Millions Without Access to Education Number of out-of-school children worldwide…
A: Provided graph: The provided graph shows the number of out of school children worldwide.
Q: A Statistics professor has observed that for several years students score an average of 117 points…
A: Given: Population mean of students score is 117 points. μ=117 Sample size of students is 238. n=238…
Q: Your investment executive claims that the average yearly rate of return on the stocks she recommends…
A:
Q: Altman Z Score 2018 2019 2020 BHP 0.80 0.71 0.63 FMG 1.12 1.26 1.38 RIO 1.36 1.34…
A: The formula for Altman Z-Score Z-Score = 1.2A + 1.4B + 3.3C + 0.6D + 1.0E where, A = working…
Q: Tim is interested in studying whether Cognitive Behavioural Therapy (CBT) is an effective treatment…
A: Given data: Participant Month 1 Month 2 1 11 6 2 8 5 3 14 17 4…
Q: Chapter 5, Section 1, Exercise 018 MORE BENEFITS OF EATING ORGANIC Using specific data, we find a…
A: Given, To find the effect of Organic Soybeans After 5 Days: After 5 days, The proportion of…
Q: You may need to use the appropriate technology to answer this question. Do students with higher…
A: a) Use the given data to construct the scatter plot:
Q: Adnan is the branch manager at a local insurance company. Recently, Adnan’s been receiving customer…
A: Using R codes : Histogram, Frequency polygon, ogive, steam and leaf and bar-plot are given below :…
Q: Large companies typically collect volumes of data before designing a product, not only to gain…
A: Solution: Given information: n1= 97 Sample size of people in my market category n2= 116 Sample size…
Q: in a study of headache patients , every one of the study subjects with a headache was found to be…
A: Introduction: In Statistics, an experiment is a study method in which, the researchers allocate the…
Q: Your investment executive claims that the average yearly rate of return on the stocks she recommends…
A:
Q: Your investment executive claims that the average yearly rate of return on the stocks she recommends…
A: The executive claims that the average yearly rate of return in the stocks she recommends is at the…
Q: Your investment executive claims that the average yearly rate of return on the stocks she recommends…
A: Hi! Thank you for the question, As per the honor code, we are allowed to answer one question at a…
Q: 8th-ed Chapter 09, Section 9.4, Problem 087
A: State the hypotheses. That is, there is no evidence that the proportion of all children in the…
Q: The Acme School of Locksmithing has been accredited for the past 15 years. Discuss how this…
A: Quantitative Variable It is a variable in which the values are obtained by counting or measuring.…
Q: On the first day of class, an economics professor administers a test to gauge the math preparedness…
A: The independent variables are Math, Hours. The dependent variable is Final score. We have to write…
Q: Using specific data, we find a significant difference in the proportion of fruit flies surviving…
A: We have to find hypothesis testing.
Q: The following data represents the wait times (in minutes) experienced by customers at a bank on…
A:
Q: given this data, what will be the most appropriate way to present them?
A: Consider the table1 and table 2 in which the data shows the study of plants over a period of 4…
Q: The table below contains data on examination of medical insurance claims. Every day 50 claims were…
A: In the given situation, there are 50 claims and the fraction nonconforming control chart. Given…
Q: 1 (part 2). Does When Food Is Eaten Affect Weight Gain?A study was introduced that examined the…
A: The provided output is: And,
Q: In a classic study of procrastination by Lay (1986), in an introductory psychology class, students…
A: a)To test:H0:μ=1H1:μ>1
Q: The cuttlefish, a cephalopod and first cousin of the octopus, has the ability to camouflage to…
A: Given data of reaction time of 10 baby cuttlefish before and after one month exposure to same…
Q: Second Grade and Ninth Grade students were given an IQ test, with no special information given to…
A: Given: Grade Teacher Expectation IQ 2nd Normal 100 2nd High 115 9th Normal 110…
Q: A researcher is interested in investigating the relationship between sugar consumption and weight…
A: The objective is to determine Treatment in the given experiment.
Q: 1 (part 1). Does When Food Is Eaten Affect Weight Gain?A study was introduced that examined the…
A:
Q: A sample of students attending a large university has been selected. Is there a statistically…
A: Given Information: liberal arts Sample mean x¯1 = 16.2 Sample standard deviation s1 = 2.3 Sample…
Q: A Statistics professor has observed that for several years students score an average of 105 points…
A: We need to construct the 95%95\% confidence interval for the population mean μ\mu . The following…
Q: each study, (a) classify the type of research that it reflects, and (b) identify the kinds of…
A: the type of research that it reflects is
Step by step
Solved in 2 steps
- An organization published an article stating that in any one-year period, approximately 7.5 percent of adults in a country suffer from depression or a depressive illness. Suppose that in a survey of 100 people in a certain town, six of them suffered from depression or a depressive illness. Conduct a hypothesis test to determine if the true proportion of people in that town suffering from depression or a depressive illness is lower than the percent in the general adult population in the country. 1. Enter your answer to two decimal places. p' = 2. Calculate ?x. (Round your answer to three decimal places.) 3. Find the p-value. (Round your answer to four decimal places.)An organization published an article stating that in any one-year period, approximately 11.5 percent of adults in a country suffer from depression or a depressive illness. Suppose that in a survey of 100 people in a certain town, nine of them suffered from depression or a depressive illness. Conduct a hypothesis test to determine if the true proportion of people in that town suffering from depression or a depressive illness is lower than the percent in the general adult population in the country. Calculate σx. (Round your answer to three decimal places.)/ Show the formula set-up. State the distribution to use for the hypothesis test. Find the p-value. (Round your answer to four decimal places.)The department of education ran a very comprehensive study in the 1990's to determine the GPA of first generation college students (those who are the first in their family to go to college) in their freshman year. The mean GPA for first generation college students was stated in teh report to be 2.37 for males and 2.21 for females. In 2018, a consumer advocacy group is interested in whether the average GPA for first generation college females was still smaller than their male counterparts. Assume the GPA's are normally distributed. A. State the null hypothesis and the alternative hypothesis. Is the advocacy group interested in a one tail or two tail test (brief explanation)? B. Find the value of the test statistic and an associated p-value (or a range for teh p-value) if 25 males SAR yielded an average GPA 2.46 with a standard deviation of 0.16 and 25 females SAR yeilded an average GPA 2.39 with a standard deviation of 0.12. C. Determine if the test requires use of the Z table or…
- Also construct a Pareto chartIn a recent survey, 32% of employed U.S. adults reported that basic mathematical skills were critical or very important to their job. The supervisor of the job placement office at a 4 year college thinks this percentage has increased due to increased use of technology in the workplace. She takes a random sample of 250 employed adults and finds that 95 of them feel that basic mathematical skills are critical or very important to their job. Is there sufficient evidence to conclude that the percentage of employed adults who feel basic mathematical skills are critical or very important to their job has increased at the a=.1 level of significance? what are the null and alternative hypotheses? determine the test statistic. Z0= ? please show work and explain how to use ti 83 calc to solveTo the Internal Revenue Service (IRS), the reasonableness of total itemized deductions depends on the taxpayer’s adjusted gross income. Large deductions, which include charity and medical deductions, are more reasonable for taxpayers with large adjusted gross incomes. If a taxpayer claims larger than average itemized deductions for a given level of income, the chances of an IRS audit are increased. Data (in thousands of dollars) on Adjusted Gross Income (AGI) and the Reasonable Amount of Itemized Deductions (RAID) are as follows: AGI : 22, 27, 32, 48, 65, 85, 120 RAID : 9.6, 9.6, 10.1, 11.1, 13.5, 17.7, 25.5 The correct interpretation of the meaning of each of the coefficients in the linear model is: a. When AGI is zero, the RAID is $4680 in this linear model. Since x = 0 is not included in the sample values of the independent variable, this interpretation cannot be a meaningful one. For every one thousand dollar of the AGI, the RAID increases by $161 in this linear model.…
- To the Internal Revenue Service (IRS), the reasonableness of total itemized deductions depends on the taxpayer’s adjusted gross income. Large deductions, which include charity and medical deductions, are more reasonable for taxpayers with large adjusted gross incomes. If a taxpayer claims larger than average itemized deductions for a given level of income, the chances of an IRS audit are increased. Data (in thousands of dollars) on Adjusted Gross Income (AGI) and the Reasonable Amount of Itemized Deductions (RAID) are as follows: AGI : 22, 27, 32, 48, 65, 85, 120 RAID : 9.6, 9.6, 10.1, 11.1, 13.5, 17.7, 25.5 Examine the attached printout and answer the following questions. The correct interpretation of the meaning of each of the coefficients in the linear model is: a. When AGI is zero, the RAID is $4680 in this linear model. Since x = 0 is not included in the sample values of the independent variable, this interpretation cannot be a meaningful one. For every one…To the Internal Revenue Service (IRS), the reasonableness of total itemized deductions depends on the taxpayer’s adjusted gross income. Large deductions, which include charity and medical deductions, are more reasonable for taxpayers with large adjusted gross incomes. If a taxpayer claims larger than average itemized deductions for a given level of income, the chances of an IRS audit are increased. Data (in thousands of dollars) on Adjusted Gross Income (AGI) and the Reasonable Amount of Itemized Deductions (RAID) are as follows: a. When AGI is zero, the RAID is $4680 in this linear model. Since x = 0 is not included in the sample values of the independent variable, this interpretation cannot be a meaningful one. For every one thousand dollar of the AGI, the RAID increases by $161 in this linear model. b. When AGI is zero, the RAID is $4680 in this linear model. For every one thousand dollar of the AGI, the RAID increases by $161 in this linear model. c. When…To the Internal Revenue Service (IRS), the reasonableness of total itemized deductions depends on the taxpayer’s adjusted gross income. Large deductions, which include charity and medical deductions, are more reasonable for taxpayers with large adjusted gross incomes. If a taxpayer claims larger than average itemized deductions for a given level of income, the chances of an IRS audit are increased. Data (in thousands of dollars) on Adjusted Gross Income (AGI) and the Reasonable Amount of Itemized Deductions (RAID) are as follows: AGI : 22, 27, 32, 48, 65, 85, 120 RAID : 9.6, 9.6, 10.1, 11.1, 13.5, 17.7, 25.5 Examine the attached printout and answer the following questions. The correct interpretation of the meaning of each of the coefficients in the linear model is:
- A study showed that the alumni of a college who had grades that were close to the average tended to have higher incomes than either the poor or very good students who graduated at the same time. Does this mean that very good grades are a handicap for those seeking high incomes? What other factors might cause this result?A random sample of 30 colleges from Kiplinger's list of the best values in private college provided the data shown in the file BestPrivateColleges.† The variable named Admit Rate (%) shows the percentage of students that applied to the college and were admitted, and the variable named 4 yr Grad. Rate (%) shows the percentage of students that were admitted and graduated in four years.A bank Manager developed a new System to reduce the time customers spend waiting for a teller service during peak hours. The Manager hopes that the new system will reduce the waiting time from the current 9 to 10 minutes to less than 6 minutes. Suppose that the Manager wishes to use the 100 waiting times to support the claim that the mean waiting time under new system is shorter than 6 minutes.a) Letting µ represent the mean waiting time under the new system, set up the null hypothesis and alternative hypothesis needed if we want to attempt to provide evidence supporting claim that µ is shorter than 6 minutes.b) In the context of this situation interpret making a type I error, interpret making a type II error.