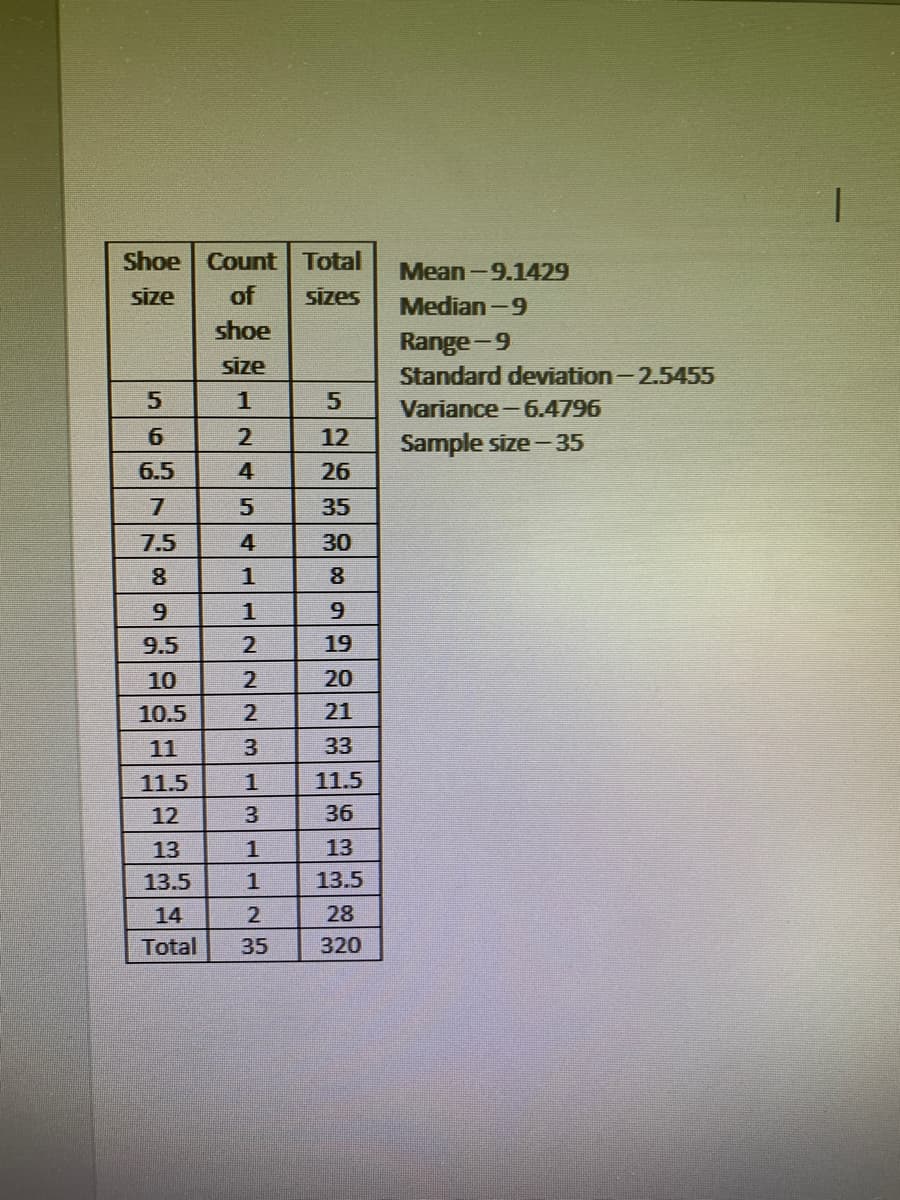
Shoe Count Total Mean-9.1429 size of sizes Median-9 shoe Range-9 size Standard deviation-2.5455 1 Variance-6.4796 | 6. 12 Sample size -35 6.5 4 26 35 7.5 4 30 8. 1 8 1 9.5 19 10 20 10.5 21 11 33 11.5 11.5 12 3 36 13 1 13 13.5 13.5 14 28 Total 35 320

MATLAB: An Introduction with Applications
6th Edition
ISBN:9781119256830
Author:Amos Gilat
Publisher:Amos Gilat
Chapter1: Starting With Matlab
Section: Chapter Questions
Problem 1P
icon
Related questions
icon
Concept explainers
Question
See attached question and stats. Confidence interval lies between 8.4157 and 9.8701
1:18
LTE
• If you can attempt to research the population mean of your sample then explain it and
compare it to your confidence interval, if you cannot then explain if you think there were
any errors in the sample you chose vs the population it was taken from.
(For example if you used only Michael Jordan stats to represent the population of all
NBA players that would not be a good sample, however you could take 30 game stats and
research his career stats for that and compare)
Transcribed Image Text:1:18 LTE • If you can attempt to research the population mean of your sample then explain it and compare it to your confidence interval, if you cannot then explain if you think there were any errors in the sample you chose vs the population it was taken from. (For example if you used only Michael Jordan stats to represent the population of all NBA players that would not be a good sample, however you could take 30 game stats and research his career stats for that and compare)
Shoe
Count Total
Mean-9.1429
size
of
sizes
Median-9
shoe
Range-9
size
Standard deviation-2.5455
Variance-6.4796
12
Sample size-35
б.5
26
35
7.5
30
8
6.
9.5
19
10
20
10.5
21
11
3
33
11.5
1
11.5
12
3
36
13
13
13.5
13.5
14
2.
28
Total
35
320
12454
567
Transcribed Image Text:Shoe Count Total Mean-9.1429 size of sizes Median-9 shoe Range-9 size Standard deviation-2.5455 Variance-6.4796 12 Sample size-35 б.5 26 35 7.5 30 8 6. 9.5 19 10 20 10.5 21 11 3 33 11.5 1 11.5 12 3 36 13 13 13.5 13.5 14 2. 28 Total 35 320 12454 567
Expert Solution
steps

Step by step

Solved in 2 steps

Blurred answer
Knowledge Booster
Correlation, Regression, and Association
Learn more about
Need a deep-dive on the concept behind this application? Look no further. Learn more about this topic, statistics and related others by exploring similar questions and additional content below.
Recommended textbooks for you
MATLAB: An Introduction with Applications
Statistics
ISBN:
9781119256830
Author:
Amos Gilat
Publisher:
John Wiley & Sons Inc
Probability and Statistics for Engineering and th…
Statistics
ISBN:
9781305251809
Author:
Jay L. Devore
Publisher:
Cengage Learning
Statistics for The Behavioral Sciences (MindTap C…
Statistics
ISBN:
9781305504912
Author:
Frederick J Gravetter, Larry B. Wallnau
Publisher:
Cengage Learning
Elementary Statistics: Picturing the World (7th E…
Statistics
ISBN:
9780134683416
Author:
Ron Larson, Betsy Farber
Publisher:
PEARSON
The Basic Practice of Statistics
Statistics
ISBN:
9781319042578
Author:
David S. Moore, William I. Notz, Michael A. Fligner
Publisher:
W. H. Freeman
Introduction to the Practice of Statistics
Statistics
ISBN:
9781319013387
Author:
David S. Moore, George P. McCabe, Bruce A. Craig
Publisher:
W. H. Freeman