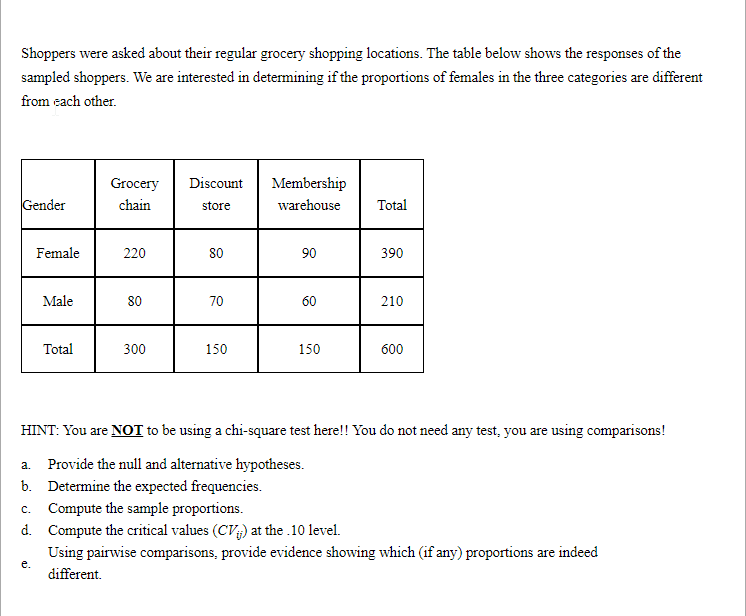
Shoppers were asked about their regular grocery shopping locations. The table below shows the responses of the sampled shoppers. We are interested in determining if the proportions of females in the three categories are different from each other. Grocery Discount Membership Gender chain warehouse Total store Female 220 80 90 390 Male 80 70 60 210 Total 300 150 150 600 HINT: You are NOT to be using a chi-square test here!! You do not need any test, you are using comparisons! a. Provide the null and alternative hypotheses. b. Determine the expected frequencies. c. Compute the sample proportions. d. Compute the critical values (CVy) at the .10 level. Using pairwise comparisons, provide evidence showing which (if any) proportions are indeed е. different.


Angles in Circles
Angles within a circle are feasible to create with the help of different properties of the circle such as radii, tangents, and chords. The radius is the distance from the center of the circle to the circumference of the circle. A tangent is a line made perpendicular to the radius through its endpoint placed on the circle as well as the line drawn at right angles to a tangent across the point of contact when the circle passes through the center of the circle. The chord is a line segment with its endpoints on the circle. A secant line or secant is the infinite extension of the chord.
Arcs in Circles
A circular arc is the arc of a circle formed by two distinct points. It is a section or segment of the circumference of a circle. A straight line passing through the center connecting the two distinct ends of the arc is termed a semi-circular arc.
Question 12. Please Show Work


Trending now
This is a popular solution!

Step by step
Solved in 3 steps with 3 images


