Snoop Incorporated is a firm that does market surveys. The Rollum Sound Company hired Snoop to study the age distribution of people who stream music. To check the Snoop report, Rollum used a random sample of 519 customers and obtained the following data. Customer Age (yrs) Less than 14 14 - 18 29 - 23 24 - 28 29 - 33 More than 33 Percent of Customers from Snoop Report 12% 29% 11% 10% 14% 24% Number of Customers from Sample 97 141 48 44 81 108 Using a 1% level of significance, test the claim that the distribution of customer ages in the Snoop report agrees with that of the sample report. (a) What is the level of significance? 0.01 State the null and alternate hypotheses. Ho: The distributions are different. H1: The distributions are different. Họ: The distributions are different. Hj: The distributions are the same. O Ho: The distributions are the same. H1: The distributions are the same. O Họ: The distributions are the same. H1: The distributions are different. (b) Find the value of the chi-square statistic for the sample. (Round the expected frequencies to at least three decimal places. Round the test statistic to three decimal places.) Are all the expected frequencies greater than 5? Yes No What sampling distribution will you use? uniform O chi-square normal Student's t What are the degrees of freedom? (c) Estimate the P-value of the sample test statistic.
Snoop Incorporated is a firm that does market surveys. The Rollum Sound Company hired Snoop to study the age distribution of people who stream music. To check the Snoop report, Rollum used a random sample of 519 customers and obtained the following data. Customer Age (yrs) Less than 14 14 - 18 29 - 23 24 - 28 29 - 33 More than 33 Percent of Customers from Snoop Report 12% 29% 11% 10% 14% 24% Number of Customers from Sample 97 141 48 44 81 108 Using a 1% level of significance, test the claim that the distribution of customer ages in the Snoop report agrees with that of the sample report. (a) What is the level of significance? 0.01 State the null and alternate hypotheses. Ho: The distributions are different. H1: The distributions are different. Họ: The distributions are different. Hj: The distributions are the same. O Ho: The distributions are the same. H1: The distributions are the same. O Họ: The distributions are the same. H1: The distributions are different. (b) Find the value of the chi-square statistic for the sample. (Round the expected frequencies to at least three decimal places. Round the test statistic to three decimal places.) Are all the expected frequencies greater than 5? Yes No What sampling distribution will you use? uniform O chi-square normal Student's t What are the degrees of freedom? (c) Estimate the P-value of the sample test statistic.

Glencoe Algebra 1, Student Edition, 9780079039897, 0079039898, 2018
18th Edition
ISBN:9780079039897
Author:Carter
Publisher:Carter
Chapter10: Statistics
Section10.6: Summarizing Categorical Data
Problem 10CYU

Related questions

Topic Video
Question
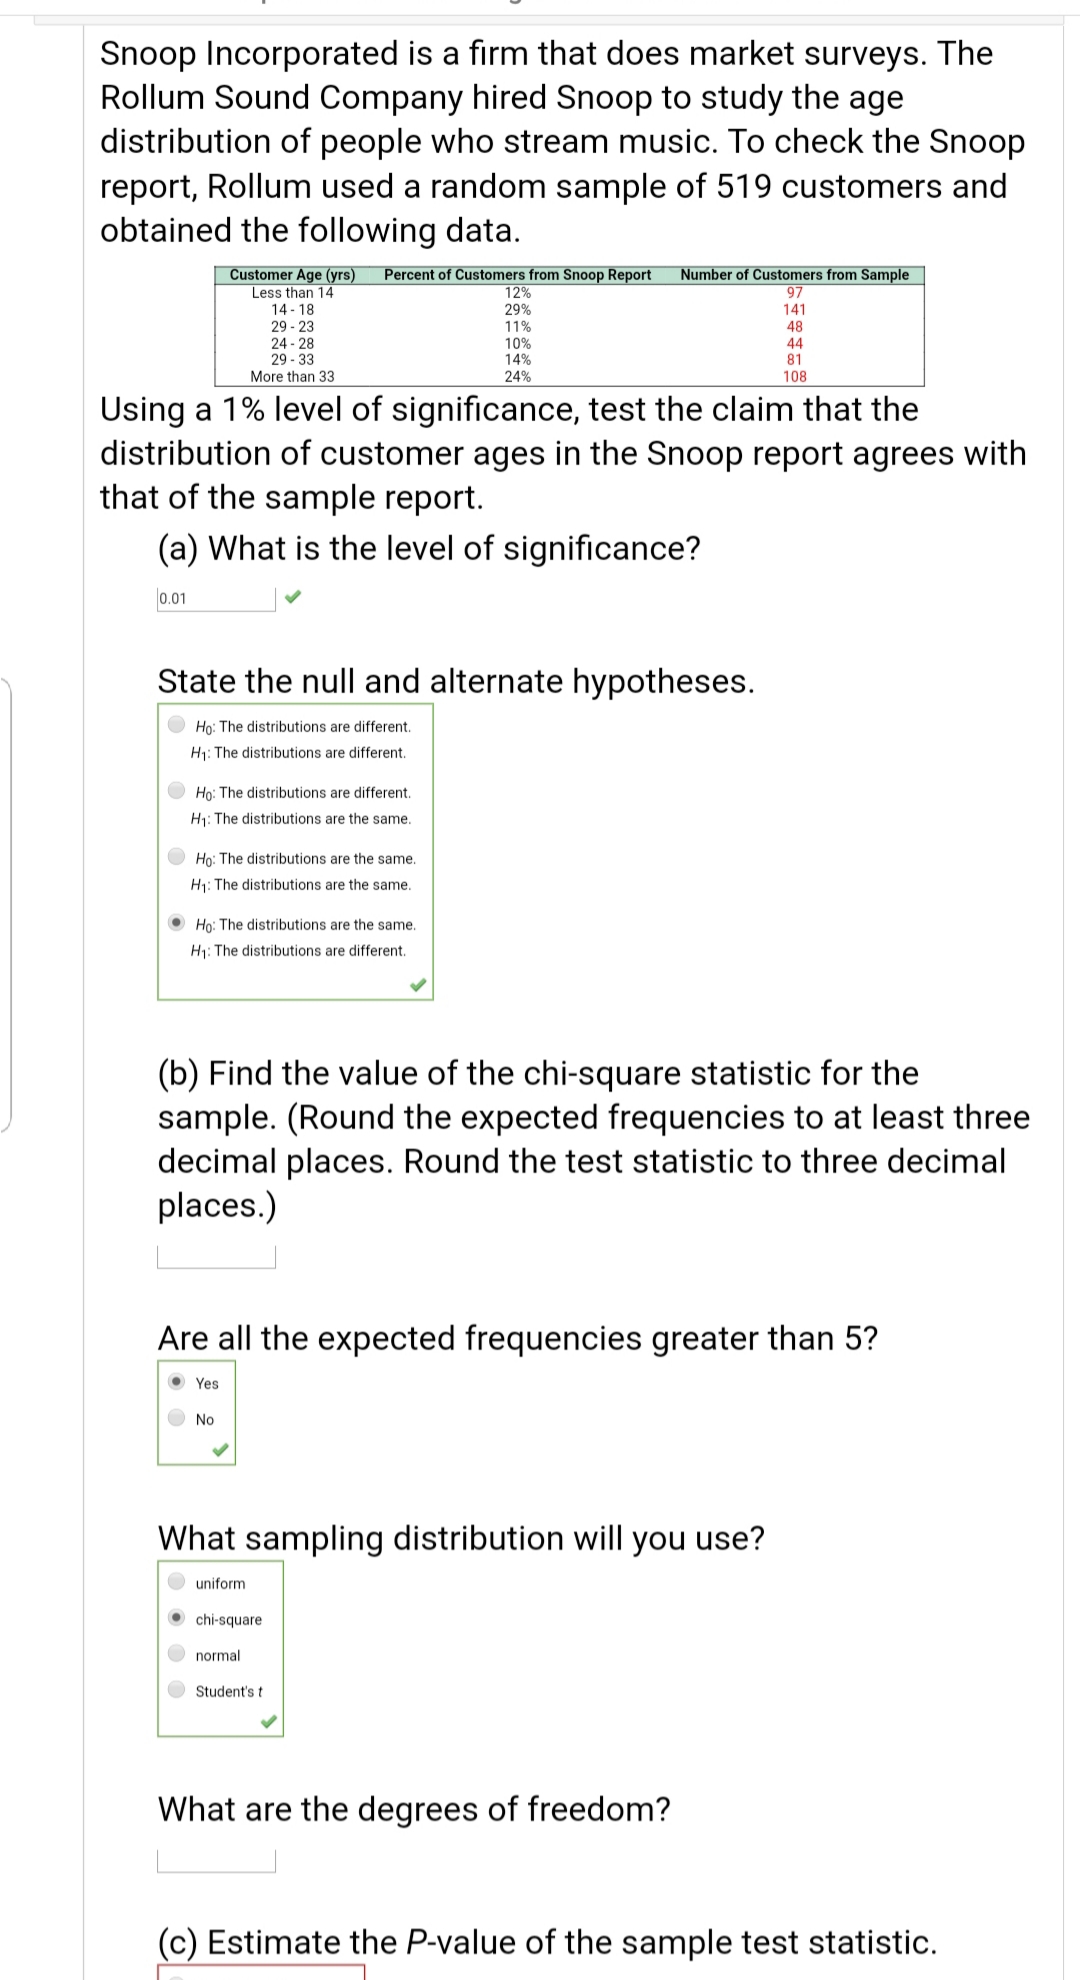
Transcribed Image Text:Snoop Incorporated is a firm that does market surveys. The
Rollum Sound Company hired Snoop to study the age
distribution of people who stream music. To check the Snoop
report, Rollum used a random sample of 519 customers and
obtained the following data.
Customer Age (yrs)
Less than 14
14 - 18
29 - 23
24 - 28
29 - 33
More than 33
Percent of Customers from Snoop Report
12%
29%
11%
10%
14%
24%
Number of Customers from Sample
97
141
48
44
81
108
Using a 1% level of significance, test the claim that the
distribution of customer ages in the Snoop report agrees with
that of the sample report.
(a) What is the level of significance?
0.01
State the null and alternate hypotheses.
Ho: The distributions are different.
H1: The distributions are different.
Họ: The distributions are different.
Hj: The distributions are the same.
O Ho: The distributions are the same.
H1: The distributions are the same.
O Họ: The distributions are the same.
H1: The distributions are different.
(b) Find the value of the chi-square statistic for the
sample. (Round the expected frequencies to at least three
decimal places. Round the test statistic to three decimal
places.)
Are all the expected frequencies greater than 5?
Yes
No
What sampling distribution will you use?
uniform
O chi-square
normal
Student's t
What are the degrees of freedom?
(c) Estimate the P-value of the sample test statistic.

Expert Solution
This question has been solved!
Explore an expertly crafted, step-by-step solution for a thorough understanding of key concepts.

This is a popular solution!

Trending now
This is a popular solution!

Step by step
Solved in 4 steps with 2 images

Knowledge Booster


Learn more about
Need a deep-dive on the concept behind this application? Look no further. Learn more about this topic, statistics and related others by exploring similar questions and additional content below.Recommended textbooks for you
Glencoe Algebra 1, Student Edition, 9780079039897…
Algebra
ISBN:
9780079039897
Author:
Carter
Publisher:
McGraw Hill

Holt Mcdougal Larson Pre-algebra: Student Edition…
Algebra
ISBN:
9780547587776
Author:
HOLT MCDOUGAL
Publisher:
HOLT MCDOUGAL

College Algebra (MindTap Course List)
Algebra
ISBN:
9781305652231
Author:
R. David Gustafson, Jeff Hughes
Publisher:
Cengage Learning
Glencoe Algebra 1, Student Edition, 9780079039897…
Algebra
ISBN:
9780079039897
Author:
Carter
Publisher:
McGraw Hill
Holt Mcdougal Larson Pre-algebra: Student Edition…
Algebra
ISBN:
9780547587776
Author:
HOLT MCDOUGAL
Publisher:
HOLT MCDOUGAL
College Algebra (MindTap Course List)
Algebra
ISBN:
9781305652231
Author:
R. David Gustafson, Jeff Hughes
Publisher:
Cengage Learning
