Solubility curves is a graphical relationship between the solubility and temperature. The solubility curve plots the changes of the solubility of a solid at different temperatures in a solvent. On a graph, the variations in temperature are plotted on the X-axis and the solubility is plotted on the Y-axis. The solubility of the solid in a particular solvent is defined as the number of grams of solute needed to saturate 100 g of solvent at a particular temperature. The solubility curves given below describes the solubility of various substance/s at different temperature. Interpret the curves and answer the question that follows. Solubility Curves 150 140 130 120 NGNO, KNO, 110 100 90 80 HCI NH.CI 70 60 NH, 50 40 Naci 30 KCIO, 20 10 so, 10 20 зо 40 so 60 7о во эо 1оо Temperature °C In general, how does temperature affect solubility? Grams of solute / 100 g H,O
Solubility curves is a graphical relationship between the solubility and temperature. The solubility curve plots the changes of the solubility of a solid at different temperatures in a solvent. On a graph, the variations in temperature are plotted on the X-axis and the solubility is plotted on the Y-axis. The solubility of the solid in a particular solvent is defined as the number of grams of solute needed to saturate 100 g of solvent at a particular temperature. The solubility curves given below describes the solubility of various substance/s at different temperature. Interpret the curves and answer the question that follows. Solubility Curves 150 140 130 120 NGNO, KNO, 110 100 90 80 HCI NH.CI 70 60 NH, 50 40 Naci 30 KCIO, 20 10 so, 10 20 зо 40 so 60 7о во эо 1оо Temperature °C In general, how does temperature affect solubility? Grams of solute / 100 g H,O

Chemistry: Matter and Change
1st Edition
ISBN:9780078746376
Author:Dinah Zike, Laurel Dingrando, Nicholas Hainen, Cheryl Wistrom
Publisher:Dinah Zike, Laurel Dingrando, Nicholas Hainen, Cheryl Wistrom
Chapter9: Chemical Reactions
Section: Chapter Questions
Problem 139A

Related questions

Question
100%
Transcribed Image Text:II. Analysis
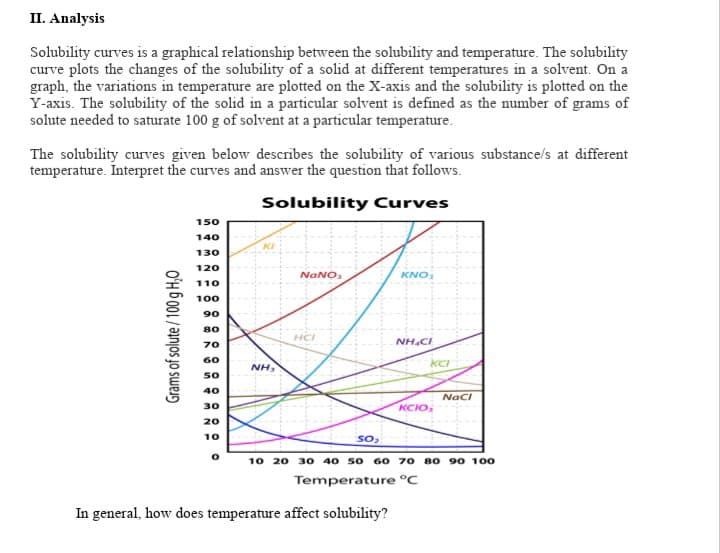
Solubility curves is a graphical relationship between the solubility and temperature. The solubility
curve plots the changes of the solubility of a solid at different temperatures in a solvent. On a
graph, the variations in temperature are plotted on the X-axis and the solubility is plotted on the
Y-axis. The solubility of the solid in a particular solvent is defined as the number of grams of
solute needed to saturate 100 g of solvent at a particular temperature.
The solubility curves given below describes the solubility of various substance/s at different
temperature. Interpret the curves and answer the question that follows.
Solubility Curves
150
140
130
120
NANO,
KNO
110
100
90
80
HC
NH.CI
70
60
KCI
NH3
50
40
Naci
30
KCIO,
20
10
So,
10 20 30 40 50 60 70 80 90 100
Temperature °C
In general, how does temperature affect solubility?
Grams of solute / 100 g H,O
Expert Solution
This question has been solved!
Explore an expertly crafted, step-by-step solution for a thorough understanding of key concepts.

This is a popular solution!

Trending now
This is a popular solution!

Step by step
Solved in 2 steps

Knowledge Booster


Learn more about
Need a deep-dive on the concept behind this application? Look no further. Learn more about this topic, chemistry and related others by exploring similar questions and additional content below.Recommended textbooks for you
Chemistry: Matter and Change
Chemistry
ISBN:
9780078746376
Author:
Dinah Zike, Laurel Dingrando, Nicholas Hainen, Cheryl Wistrom
Publisher:
Glencoe/McGraw-Hill School Pub Co

Introductory Chemistry: An Active Learning Approa…
Chemistry
ISBN:
9781305079250
Author:
Mark S. Cracolice, Ed Peters
Publisher:
Cengage Learning

Chemistry: Principles and Practice
Chemistry
ISBN:
9780534420123
Author:
Daniel L. Reger, Scott R. Goode, David W. Ball, Edward Mercer
Publisher:
Cengage Learning
Chemistry: Matter and Change
Chemistry
ISBN:
9780078746376
Author:
Dinah Zike, Laurel Dingrando, Nicholas Hainen, Cheryl Wistrom
Publisher:
Glencoe/McGraw-Hill School Pub Co
Introductory Chemistry: An Active Learning Approa…
Chemistry
ISBN:
9781305079250
Author:
Mark S. Cracolice, Ed Peters
Publisher:
Cengage Learning
Chemistry: Principles and Practice
Chemistry
ISBN:
9780534420123
Author:
Daniel L. Reger, Scott R. Goode, David W. Ball, Edward Mercer
Publisher:
Cengage Learning

Chemistry
Chemistry
ISBN:
9781305957404
Author:
Steven S. Zumdahl, Susan A. Zumdahl, Donald J. DeCoste
Publisher:
Cengage Learning


Chemistry: An Atoms First Approach
Chemistry
ISBN:
9781305079243
Author:
Steven S. Zumdahl, Susan A. Zumdahl
Publisher:
Cengage Learning