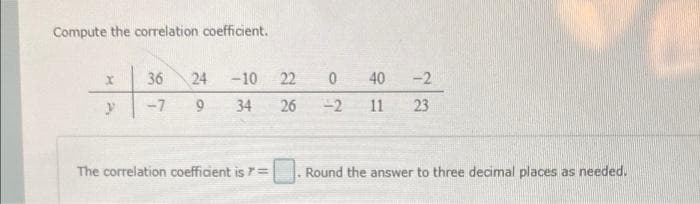
Compute the correlation coefficient. X y 36 24 -10 -7 9 34 The correlation coefficient is = 22 0 40 -2 26 -2 11 23 Round the answer to three decimal places as needed.


Q: 6. Construct a stem-and-leaf for the data with a 1-digit stem, leaves do NOT need to be in order.…
A: The given data is 644, 581, 431, 644, 820, 773, 899, 417, 858.
Q: The population mean (u) represents a ___? A. Parameter B. Statistic
A: we have to find population mean represents what parameter or statistics.
Q: An outbreak of salmonellosis occurred after an Eagle Scout ceremony, which was attended by 30 scouts…
A: The provided data for the exposed (i.e., the individuals, who ate the food) and unexposed (i.e., the…
Q: The grades are given the fe work, a student at Univer rs of C, and 3 credit hours te the students'…
A: Weighted mean is the term used when some quantities are more significant than others and do not…
Q: Find Decile 1 and Decile 2 and base your answer from the formula provided.
A:
Q: t X be a random variable which represents the lifetime in years of a particular battery. We are…
A: Given: X is lifetime in years of a battery X ~ Exp λ=0.15 Let a denote 99 percentile. P(X < a )=…
Q: Find the interquartile range of the following numbers: 9 10 8 12 8 7 8 4 20 12 7 9 12 9 6 11 9 8 9…
A: Introduction Researchers could gauge how segmented the original data set is by examining the range.…
Q: cm. Based on statistics from a data set, his height converts to the z score of 5.17. How many…
A:
Q: Find 24th percentile, P24, from the following data
A: Given: Observations 100 120 140 170 190 210 230 290 300 320 330 350 400…
Q: The following data represent the number of people aged 25 to 64 years covered by health insurance…
A: The data shows the number of people aged 25 to 64 years covered by health insurance in 2018.
Q: Without using MGF technique, prove or disapprove that is a pivotal quantity
A:
Q: The accompanying data represent the weights (in grams) of a simple random sample of 50 candies.…
A: The frequency table (as per the given data table) is constructed as follows: X (weights) f…
Q: A student selects 49 batteries from a population with a mean mass value of 72±7.0 g (u±s). She…
A: Given information: μ=72, σ=7x¯=74, n=49
Q: ompute Find the 90% Confidence Interval below.
A: From given data we have ; 2,99,000 1,15,000 1,45,000 2,19,000 1,39,900 75,000…
Q: n a recent poll, a random sample of adults in some country (18 years and older) was asked, "When…
A: Given : Purchase like 18-34 35-44 45-54 55+ Total More Likely 226 385 397 400 1408 Less…
Q: 2. Sleep habits of College freshmen were investigated. Below are the data gathered on the number of…
A: We have given that, Hours (x) studnets (f) 5 13 6 16 7 28 8 25 9 10 10 8 Then,…
Q: 5. The grade point average (GPA) for college students is based on a weighted mean computation. For…
A: Given data: Grades(x): A(4), B(3), C(2), D(1) and F(0) Credits hours earned by student(w) for each…
Q: The claim is that weights (grams) of quarters made after 1964 have a mean equal to 5.670 g as…
A: From the provided information, Sample size (n) = 37 Test statistic (t) = -2.706 Level of…
Q: (a) Determine the population mean pulse. The population mean pulse is approximately (Round to one…
A: Given: Population size, N=9 Student Pulse Perceptual Bempah 86 Megan Brooks 73 Jeff…
Q: Find the probability of no correct answers.
A: Let p be probability of getting correct answer. Given that p = 0.20 Let X denote the number of…
Q: In a packing plant, a machine packs cartons with jars. It is supposed that a new machine will pack…
A:
Q: In the following data set of book costs(dollars), determine the percentile of 67. 28 1 58 31 67 67…
A:
Q: Consider the following population: {6, 7, 8, 9). For this population the mean is μ = Suppose that a…
A: Given data, Population = {6,7,8,9}. Population mean is given as 7.5. Provided possible samples are…
Q: banker finds that the number of times people use automated-teller machines (ATMs) in a year are…
A: We have given Mean(µ) = 40Standard deviations (σ) = 11.2X ~ N (µ, σ )= N(40, 11.2)
Q: Miles per Gallon 28 25 25 23 30 32 21 a. Show tabular computations here b. Show complete solution of…
A: It is given that the Department of Transportation on driving speed and miles per gallon for midsized…
Q: 5) A maize farmer plans to plant varieties X and Y of maize each in four plots. Illustrate a…
A:
Q: Describe the distribution you will use to build the confidence interval. x-bar = 229,615 Sx =…
A: Here in this question we have information about x-bar, Sx , minimum price, maximum price, First…
Q: A random sample of 10 subjects have weights with a standard deviation of 13.5217 kg. What is the…
A:
Q: Income (in Dollars) 60,000 48,000 36,000 24,000 12,000 0 Per Capita Personal Income by State for…
A: From the given histogram, which represents the "state" on the x-axis, and "per capita personal…
Q: (4) The following data examines whether there is a relationship between the number of absences in a…
A: Given: Absences (x) Final Grade (y) 6 74 9 60 4 75 2 87 0 92 5 74 4 80 3 82 6…
Q: 4. Answer the question below. (a.) A random variable X has mean μ = 8 and σ = 3. What is the largest…
A:
Q: 个 Here are summary statistics for randomly selected weights of newborn girls: n= 166, x= 28.3 hg, s=…
A: Given that n=166, xbar=28.3hg, s=3.1hg n=12, xbar=28.4hg, s=1.9hg Confidence level=99%
Q: The sample mean amount of savings is $ 237 (Round to the nearest dollar as needed.) The sample…
A: It is given that the data in the table represent the responses to the survey amount of savings.
Q: | 4. Suppose that Y₁, Y2, Y is a random sample of size m from Gamma(a = 3, B=0), where is not known.…
A: Given i=1,2,...,n
Q: The accompanying data are lengths (inches) of bears. Find the percentile corresponding to 68.0 in.…
A: Data is given We have to calculate Percentile corresponding to 68.0 In data, 68.0 is at 43rd…
Q: The gas mileages (in miles per gallon) for 34 cars are shown in the frequency distribution.…
A: The frequency distribution table of gas mileage is given.
Q: Use the information below to construct a 2x2 table and answer the following question: Risk Factor…
A: Given that: Risk Factor Outcome Has Outcome Does not have outcome Exposed 19 139 Not…
Q: If you use 95% as your confidence level, and provided that all possible samples are taken, it means…
A: Confidence interval is estimated to understand the range where the true population parameter likely…
Q: Suppose that a random sample X₁, X₂,...,X20 follows an exponential distribution with parameter ß.…
A:
Q: (c) Estimate the percentage of amounts that were between $42.92 and $45.75, Round the answer to one…
A:
Q: 4. Suppose that Y₁, Y₂, ..., Y is a random sample of size m from Gamma (a = 3,ß = 0), where 0 is not…
A: Given Y1,Y2,..,Yn be the random sample
Q: a. Which measure of central tendency should we use here? b. What would be the mean, median and mode?…
A: Given: number of subjects(n)=6 Subject Number Math 5 English 3 Science 4 Music 1 Arts…
Q: AnswerHow to enter your answer (opens in new window) 2 Points Key: 101 101 pounds Step 3 of 3: What…
A: It is given that the stem and leaf plot.
Q: TA file 6 6 8 7 3 3 8 7 5 9 4 3 8 4 4 5 6 5 9 995 9 7 8 3 10 8 9 velop a 95% confidence interval…
A: There are 50 observations; n=50 6 4 6 8 7 7 6 3 3 8 10 4 8 7 8 7 5 9 5 8 4 3 8 5 5 4 4 4 8 4…
Q: Find the percentage of students that scores higher than 95.5 round your answer to the nearest…
A: From the given histogram we have to find percentage of students that scores higher than 95.5
Q: 4) Which among the following experimental set-ups (a, b, c) have a lesser experimental error?…
A: Experimental error: This term is vaguely used in Design of experiments. It may be defined as the…
Q: Susan has just completed her second semester in college. She earned a grade of C in her 1-hour…
A: For the given data Find Susan's grade point average is =?
Q: Calculate the mean, median, mode, range and standard deviation of the data: -5, -3, -3, 1, 9
A: We have given data 5, -3, -3, 1, 9 We have to make the following table to compute median, mode,…
Q: 2. The Department of Trade and Industry reported that the mean retail price per gallon of a certain…
A: Solution-: Given: μ=140.5,σ=5 Let, X= The retail price per gallon of a certain product ∴X→…

Step by step
Solved in 2 steps with 2 images

- 1. Move the slider so that the correlation coefficient is r = -0.9. At an x-axis value of 40, which of the following is the approximate range (lowest to highest) of the y-values?2. Now move the slider so that the correlation coefficient is r = 0.15. At an x-axis value of 40, which of the following is the approximate range (lowest to highest) of the y-values?We have obtain the following x-y-pairs of data: x 1.8 10 4.2 7 -8.3 y 6.3 9.6 7.4 -1.3 -1.6 Compute the correlation coefficient for this data and enter it to at least 2 decimal places.