Step 1: Short-Run Equilibrium The following graph shows an aggregate demand (AD) curve and a short-run aggregate supply (SRAS) curve for an economy. Suppose that the economy is initially in a short-run equilibrium: at PE, and Real GDP is 10 trillion. Suppose that at some point, the price increases to p*. (?)
Step 1: Short-Run Equilibrium The following graph shows an aggregate demand (AD) curve and a short-run aggregate supply (SRAS) curve for an economy. Suppose that the economy is initially in a short-run equilibrium: at PE, and Real GDP is 10 trillion. Suppose that at some point, the price increases to p*. (?)

Macroeconomics: Private and Public Choice (MindTap Course List)
16th Edition
ISBN:9781305506756
Author:James D. Gwartney, Richard L. Stroup, Russell S. Sobel, David A. Macpherson
Publisher:James D. Gwartney, Richard L. Stroup, Russell S. Sobel, David A. Macpherson
Chapter9: An Introduction To Basic Macroeconomic Markets
Section: Chapter Questions
Problem 15CQ

Related questions
Question
Confused and not sure how to answer
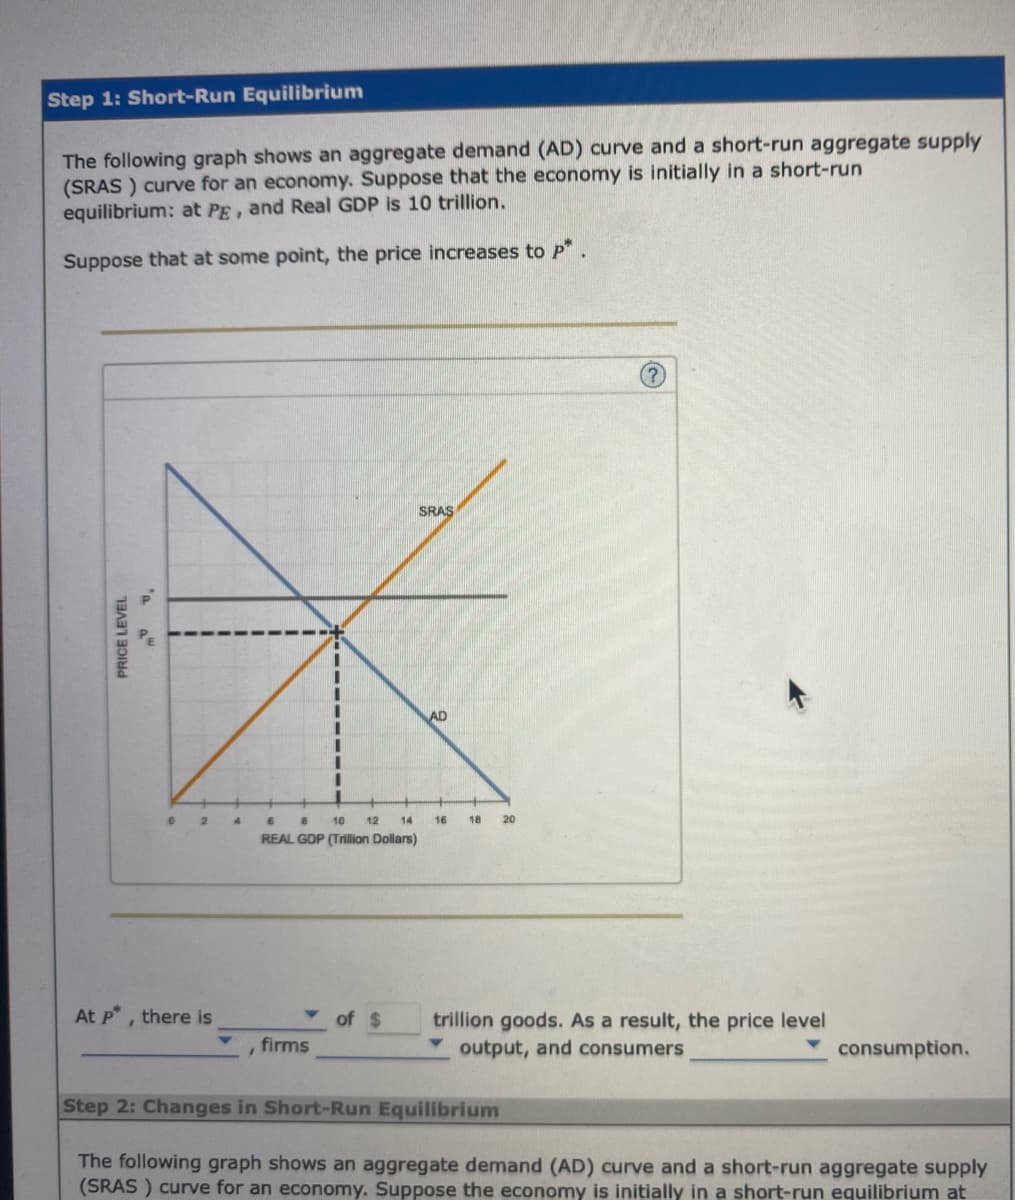
Transcribed Image Text:Step 1: Short-Run Equilibrium
The following graph shows an aggregate demand (AD) curve and a short-run aggregate supply
(SRAS) curve for an economy. Suppose that the economy is initially in a short-run
equilibrium: at PE, and Real GDP is 10 trillion.
Suppose that at some point, the price increases to p*.
PRICE LEVEL
0 2
At p*, there is
firms
SRAS
6
B 10 12 14 16
REAL GDP (Trillion Dollars)
of $
AD
18 20
trillion goods. As a result, the price level
output, and consumers
consumption.
Step 2: Changes in Short-Run Equilibrium
The following graph shows an aggregate demand (AD) curve and a short-run aggregate supply
(SRAS) curve for an economy. Suppose the economy is initially in a short-run equilibrium at
Transcribed Image Text:Step 2: Changes in Short-Run Equilibrium
The following graph shows an aggregate demand (AD) curve and a short-run aggregate supply
(SRAS) curve for an economy. Suppose the economy is initially in a short-run equilibrium at
PE, and Real GDP is 10trillion.
At some point, the economy experiences an increase in wage rates.
Adjust the following graph to show the effect of an increase in wage rates on the economy.
(?)
Price Level
a
0
2
6
8 10 12 14
Real GDP (Trillions Dollars)
SRAS
AD
18
中田中器
SRAS
Which of the following best describes the effect of an increase in wage rates?
The price level rises above PE, but the Real GDP remains the same.
The price level rises above PE, and the Real GDP decreases to $6 trillion.
The price level falls below PE, and the Real GDP increases to $6 trillion.
The price level remains the same, but the Real GDP decreases to $6 trillion.
Suppose the economy experiences an increase in the interest rate. Adjust the graph to show
the effect of an increase in the interest rate on the economy.
Which of the following best describes the effect of an increase in the interest rate?
The price level falls even further below PE, and Real GDP decreases from $6 trillion
to $4 trillion.
The price level rises even higher above PE, and Real GDP increases from $6 trillion
to $4 trillion.
The price level falls but still remains above PE and Real GDP decreases further from
$6 trillion to $4 trillion.
The price level rises back to PE, and Real GDP increases from $6 trillion to $4
trillion.
Expert Solution
This question has been solved!
Explore an expertly crafted, step-by-step solution for a thorough understanding of key concepts.

This is a popular solution!

Trending now
This is a popular solution!

Step by step
Solved in 2 steps with 3 images

Knowledge Booster


Learn more about
Need a deep-dive on the concept behind this application? Look no further. Learn more about this topic, economics and related others by exploring similar questions and additional content below.Recommended textbooks for you
Macroeconomics: Private and Public Choice (MindTa…
Economics
ISBN:
9781305506756
Author:
James D. Gwartney, Richard L. Stroup, Russell S. Sobel, David A. Macpherson
Publisher:
Cengage Learning

Economics: Private and Public Choice (MindTap Cou…
Economics
ISBN:
9781305506725
Author:
James D. Gwartney, Richard L. Stroup, Russell S. Sobel, David A. Macpherson
Publisher:
Cengage Learning

Macroeconomics: Private and Public Choice (MindTa…
Economics
ISBN:
9781305506756
Author:
James D. Gwartney, Richard L. Stroup, Russell S. Sobel, David A. Macpherson
Publisher:
Cengage Learning
Economics: Private and Public Choice (MindTap Cou…
Economics
ISBN:
9781305506725
Author:
James D. Gwartney, Richard L. Stroup, Russell S. Sobel, David A. Macpherson
Publisher:
Cengage Learning


Economics (MindTap Course List)
Economics
ISBN:
9781337617383
Author:
Roger A. Arnold
Publisher:
Cengage Learning