Storing tabular data as pandas dataframe:
(a) Data preprocessing is one of the steps in machine learning. The pandas library in python is suitable to deal with tabular data. Create a variable ‘emissions’ and assign to it the following data (Table 1) as padas DataFrame. Create an excel file ‘emissions_from_pandas.xlsx’ from the ‘emissions’ variable using python.
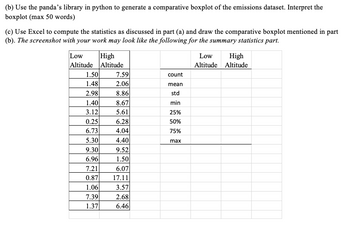
Table 1. Particulate matter (PM) emissions (in g/gal) for 15 vehicles driven at low altitude and another 15 vehicles driven at high altitude.
|
Low Altitude |
High Altitude |
|
1.50 |
7.59 |
|
1.48 |
2.06 |
|
2.98 |
8.86 |
|
1.40 |
8.67 |
|
3.12 |
5.61 |
|
0.25 |
6.28 |
|
6.73 |
4.04 |
|
5.30 |
4.40 |
|
9.30 |
9.52 |
|
6.96 |
1.50 |
|
7.21 |
6.07 |
|
0.87 |
17.11 |
|
1.06 |
3.57 |
|
7.39 |
2.68 |
|
1.37 |
6.46 |
iloc[] method:
(b) Using the .iloc[] method, we can access any part of the dataframe. Run the following commands and show the outputs:
emissions.head()
emissions.iloc[0,0]
emissions.iloc[1,1]
emissions.iloc[0:2,0:2]
emissions.iloc[2:4,:]
Step by stepSolved in 8 steps with 7 images


File conversion:
(c) Create an xl file "emissions_from_pandas.xlsx" from the emissions variable using the .to_excel method. Paste the screenshot of the input command.
(d) Create an MS Excel file ‘emissions_excel.xlsx’ containing the data in Table 1 above with the column header and save it on your computer. Create a variable ‘emissions_from_excel’ from the ‘emissions_excel.xlsx’ file using pd_read function. Show the first five rows using .head(). Paste a screenshot with the input commands used.
- Can you use Python programming language to to this question? Thanksarrow_forwardPYTHON / DATA ORGANIZATION Import the following reaction mechanism for syngas production from the course repository data/syngas-short-rxn.txt, keep the order of the reactions the same, and display the reactions.The reaction mechanism is given below kindly write code assuming its to be extracted. # Corrected ChatGPT## Pyrolysis (Destruction of Feedstock):C(s) -> C(g)# Primary Oxidation (Partial Combustion):2 C(g) + O2 -> 2 CO# Secondary Oxidation (Complete Combustion):CO + 0.5 O2 -> CO2# Methanation:C(g) + H2O -> CO + H2# Shift Methane Reaction (Methane Decomposition):CH4 <=> C(g) + 2 H2arrow_forwardWrite this using a java script function and test with a mocha or postman to see if it passes the testarrow_forward
 Computer Networking: A Top-Down Approach (7th Edi...Computer EngineeringISBN:9780133594140Author:James Kurose, Keith RossPublisher:PEARSON
 Computer Organization and Design MIPS Edition, Fi...Computer EngineeringISBN:9780124077263Author:David A. Patterson, John L. HennessyPublisher:Elsevier Science
 Network+ Guide to Networks (MindTap Course List)Computer EngineeringISBN:9781337569330Author:Jill West, Tamara Dean, Jean AndrewsPublisher:Cengage Learning
 Concepts of Database ManagementComputer EngineeringISBN:9781337093422Author:Joy L. Starks, Philip J. Pratt, Mary Z. LastPublisher:Cengage Learning
 Prelude to ProgrammingComputer EngineeringISBN:9780133750423Author:VENIT, StewartPublisher:Pearson Education
 Sc Business Data Communications and Networking, T...Computer EngineeringISBN:9781119368830Author:FITZGERALDPublisher:WILEY


