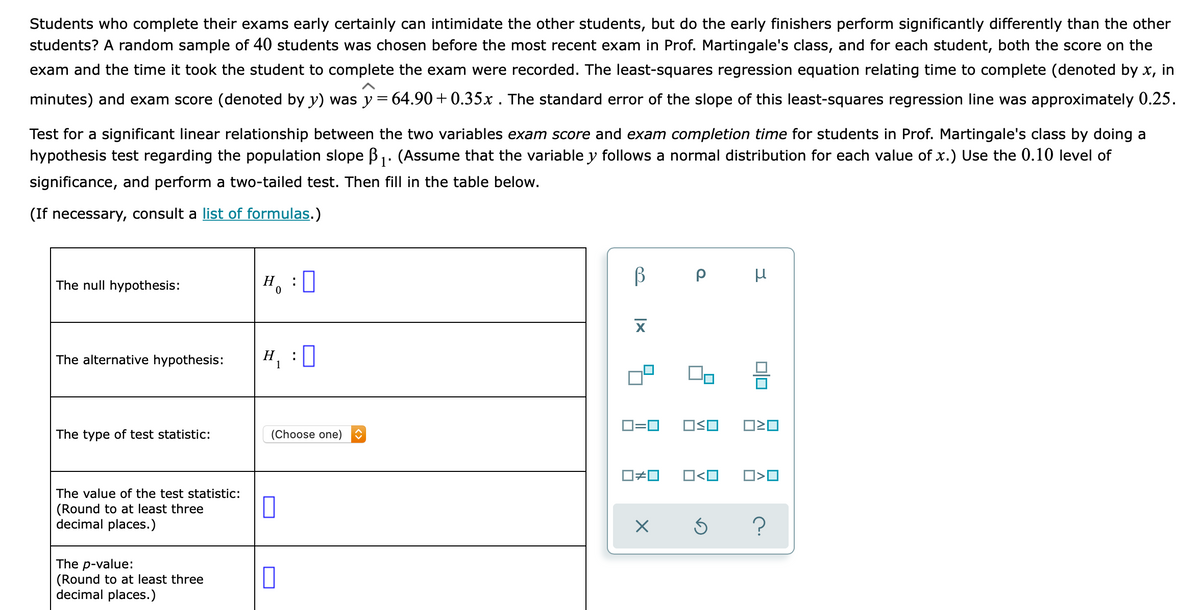
Students who complete their exams early certainly can intimidate the other students, but do the early finishers perform significantly differently than the other students? A random sample of 40 students was chosen before the most recent exam in Prof. Martingale's class, and for each student, both the score on the exam and the time it took the student to complete the exam were recorded. The least-squares regression equation relating time to complete (denoted by x, in minutes) and exam score (denoted by y) was y=64.90+0.35x . The standard error of the slope of this least-squares regression line was approximately 0.25. Test for a significant linear relationship between the two variables exam score and exam completion time for students in Prof. Martingale's class by doing a hypothesis test regarding the population slope B1. (Assume that the variable y follows a normal distribution for each value of x.) Use the 0.10 level of significance, and perform a two-tailed test. Then fill in the table below. (If necessary, consult a list of formulas.) The null hypothesis: H, :0 The alternative hypothesis: H, :0 D=0 OSO The type of test statistic: (Choose one) The value of the test statistic: (Round to at least three decimal places.) The p-value: (Round to at least three decimal places.)


Correlation
Correlation defines a relationship between two independent variables. It tells the degree to which variables move in relation to each other. When two sets of data are related to each other, there is a correlation between them.
Linear Correlation
A correlation is used to determine the relationships between numerical and categorical variables. In other words, it is an indicator of how things are connected to one another. The correlation analysis is the study of how variables are related.
Regression Analysis
Regression analysis is a statistical method in which it estimates the relationship between a dependent variable and one or more independent variable. In simple terms dependent variable is called as outcome variable and independent variable is called as predictors. Regression analysis is one of the methods to find the trends in data. The independent variable used in Regression analysis is named Predictor variable. It offers data of an associated dependent variable regarding a particular outcome.


Trending now
This is a popular solution!

Step by step
Solved in 2 steps with 3 images


