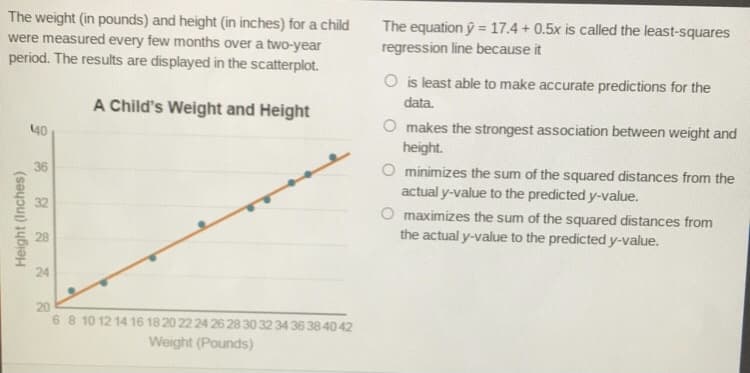
The weight (in pounds) and height (in inches) for a child were measured every few months over a two-year period. The results are displayed in the scatterplot. The equation ý = 17.4 + 0.5x is called the least-squares regression line because it O is least able to make accurate predictions for the A Child's Weight and Height data. O makes the strongest association between weight and height. 40 36 O minimizes the sum of the squared distances from the actual y-value to the predicted y-value. 32 maximizes the sum of the squared distances from the actual y-value to the predicted y-value. 24 20 68 10 12 14 16 18 20 22 24 26 28 30 32 34 36 38 40 42 Height (Inches)
The weight (in pounds) and height (in inches) for a child were measured every few months over a two-year period. The results are displayed in the scatterplot. The equation ý = 17.4 + 0.5x is called the least-squares regression line because it O is least able to make accurate predictions for the A Child's Weight and Height data. O makes the strongest association between weight and height. 40 36 O minimizes the sum of the squared distances from the actual y-value to the predicted y-value. 32 maximizes the sum of the squared distances from the actual y-value to the predicted y-value. 24 20 68 10 12 14 16 18 20 22 24 26 28 30 32 34 36 38 40 42 Height (Inches)

Linear Algebra: A Modern Introduction
4th Edition
ISBN:9781285463247
Author:David Poole
Publisher:David Poole
Chapter7: Distance And Approximation
Section7.3: Least Squares Approximation
Problem 31EQ

Related questions

Question
100%
Question on image!
Transcribed Image Text:The weight (in pounds) and height (in inches) for a child
were measured every few months over a two-year
period. The results are displayed in the scatterplot.
The equation ý = 17.4 + 0.5x is called the least-squares
regression line because it
O is least able to make accurate predictions for the
A Child's Weight and Height
data.
O makes the strongest association between weight and
height.
40
36
O minimizes the sum of the squared distances from the
actual y-value to the predicted y-value.
O maximizes the sum of the squared distances from
the actual y-value to the predicted y-value.
32
24
20
68 10 12 14 16 18 20 22 24 26 28 30 32 34 3638 40 42
Weight (Pounds)
Height (Inches)
Expert Solution
This question has been solved!
Explore an expertly crafted, step-by-step solution for a thorough understanding of key concepts.

This is a popular solution!

Trending now
This is a popular solution!

Step by step
Solved in 2 steps with 1 images

Knowledge Booster


Learn more about
Need a deep-dive on the concept behind this application? Look no further. Learn more about this topic, statistics and related others by exploring similar questions and additional content below.Recommended textbooks for you
Linear Algebra: A Modern Introduction
Algebra
ISBN:
9781285463247
Author:
David Poole
Publisher:
Cengage Learning

Glencoe Algebra 1, Student Edition, 9780079039897…
Algebra
ISBN:
9780079039897
Author:
Carter
Publisher:
McGraw Hill

Functions and Change: A Modeling Approach to Coll…
Algebra
ISBN:
9781337111348
Author:
Bruce Crauder, Benny Evans, Alan Noell
Publisher:
Cengage Learning
Linear Algebra: A Modern Introduction
Algebra
ISBN:
9781285463247
Author:
David Poole
Publisher:
Cengage Learning
Glencoe Algebra 1, Student Edition, 9780079039897…
Algebra
ISBN:
9780079039897
Author:
Carter
Publisher:
McGraw Hill
Functions and Change: A Modeling Approach to Coll…
Algebra
ISBN:
9781337111348
Author:
Bruce Crauder, Benny Evans, Alan Noell
Publisher:
Cengage Learning