SUMMARY Groups Count Sum Average Variance Business 18 1208 151 386 Computer Science 17 932 133.1429 253.4762 Law 16 898 149.6667 360.2667 ANOVA Source of Variation Iss df MS P-value F crit Between Groups A 700.2381 F 0.152404 G Within Groups 6024.19 C H Total
Q: A magazine published data on the best small firms in a certain year. These were firms that had been…
A:
Q: 1. In a study among Graduate Education students, forty-six (12 freshmen, 11 sophomores, 10 juniors,…
A: Given:
Q: The International Air Transport Association surveys business travelers to develop quality ratings…
A: Obtain the mean and standard deviation of ratings for the random sample of 50 business travelers of…
Q: A sample was taken of the salaries of four employees from a large company. The following are their…
A:
Q: A senior accounting major at Midsouth State University has job offers from four CPA firms. To…
A: The degrees of freedom are 3 and 11.
Q: A teacher used the scores of 9 students to identify the variability of students’ performance on the…
A: Here sample size, n= 9 Variability is given by, Var=(summation X^2)/n -{(summationXi)/n}^2
Q: Find the mean, mode, median, range, standard deviation, variance, skewness, and kurtosis of CGPA…
A: Given - The above 25 samples are given below n= 25 ∑x= 69.69 To Find - a) Mean ,Mode ,…
Q: Choose the correct decision and summary based on the above p-value. Reject H0. There is no evidence…
A:
Q: (a) Consider the following set of a sample data: 320 320 330 320 320 330 500 320 320 310 300 320 320…
A:
Q: A movie theater company wants to see if there is a difference in the average movie ticket sales in…
A: The test for the difference between the mean of two sample is tested using the t test for unequal…
Q: The following are final grades (in terms of percentages) from a class of 20 students. 70 2 75 70 84…
A:
Q: a survey examining health-related behaviors among university students, 200 participants were asked…
A: Calculate Sample Variance (S2) from the following grouped data X Frequency 0 145 2 25 5 20…
Q: A government agency computed the proportion of U.S. residents who lived in each of four geographic…
A: For the given data State the Hypotheses
Q: A senior accounting major at Midsouth State University has job offers from four CPA firms. To…
A: According to the provided data, the F- critical value can be obtained using the F-distribution…
Q: A university employment office wants to compare the time taken by graduates with three different…
A: The study shows the first full-time job after graduation.
Q: Find the variance for this data set of numbers: 58,64,24,28,38,46
A: Given sample is: 58,64,24,28,38,46. Sample size = n = 6.
Q: An MBA student wants to answer the question "How does an MBA major affect the number of job offers…
A: The complete ANOVA table is given below:
Q: The number of minutes spent by 15 AGM airline passengers "checking in" are as follows: 9 8 10 10 6…
A:
Q: 1. A researcher investigates the amount of homework required by different academic majors, to…
A: Given: F3,24=3.17
Q: For an analysis of variance comparing six treatment means with a separate sample of n = 7…
A: From the provided information, Number of treatment (k) = 6 Number of participants in each treatment…
Q: Researchers are trying to see if the English AP scores from four different Massachusetts private…
A: The following data is given: School b Mean St. Dev BB&N 23 4.3 0.4 Roxbury Latin 25 3.9…
Q: Rin's Gym Data Find the sample covariances among height, weight, and calculated BMI, Complete the…
A: The formula for sample covariance is given by: covx,y=∑i=1nxi-xyi-yn-1 Let X represents the height,…
Q: ) What is the population average and variance of weight loss in this group? b) What is the…
A: a. Previous weight (lbs) Previous Heart rate (bpm) Weekly Exercise (hr) New Weight(lbs) New Heart…
Q: A senior accounting major at Midsouth State University has job offers from four CPA firms. To…
A: The critical value is obtained be using the Excel function “=F.INV.RT(probability value, degree of…
Q: To compare customer satisfaction levels of two competing ice cream companies, 8 customers of Company…
A: Given: n1 = 8 X1 = 3.21 σ1 = 0.31 n2 = 5 X2 = 2.22 σ2 = 0.21 Level of confidence = 95% Level of…
Q: A senior accounting major at Midsouth State University has job offers from four CPA firms. To…
A: From the provided information, The degrees of freedom, df1 = 3 and df2 = 10. And significance level…
Q: The following data represent the number of packages of 5 popular brands of cigarettes sold by a…
A:
Q: A senior accounting major at Midsouth State University has job offers from four CPA firms. To…
A: State the hypotheses. That is, there is no evidence that there is a difference in the mean number…
Q: If a sample of 362 customers is taken from a population of 5530 customers, the sample variance, s,…
A: Solution -Given that Sample size n=362 Population size N=5530
Q: Find the variance for the population consisting of the measurements ½, ¼, 1/3, ½, and 1/8 by using…
A: The population mean is, μ=∑XN=12+6+8+12+35=415=8.2 The population mean is 8.2.
Q: corporate CEOs for a random sample of these firms. 47 57 52 62 55 59 74 63 53 50 59 60 60 57 46 55…
A: Let X be the age of CEOs for top small firms. x¯ : Sample mean of age of CEOs for top small firms.…
Q: What statistical tool should be used when you want to compare 4 refrigerators to know if there is a…
A: Given Information: Consider the information in which you want to compare 4 refrigerators.
Q: Consider a population of 8 students. Suppose we know the test scores of the students to be 3 4 5 6 7…
A: Given : To find : Mean and variance of the popl.
Q: Africa during 2010 had the following distribution according to the principal types of accidents.…
A: Solution: Given information: k= 6 categories n= 442 +161+ 42+33+161+150 n= 990 total number of…
Q: 4. The following are the data on sales (in thousand Pesos) over a fixed period of time from a random…
A: Following are the explanation of the question.
Q: A sample size of 9 is taken with results given by: 7.07, 7.00, 7.10, 6.97, 7.00, 7.03, 7.01, 6.98,…
A: Here use formula of sample variance
Q: An analysis of variance produces SStotal = 80 and SSwithin = 30. For this analysis, what is…
A: Given that, The the formula for calculating the SStotal is
Q: 1. In a study among Graduate Education students, forty-six (12 freshmen, 11 sophomores, 10 juniors,…
A: The result of the ANOVA table is given where the F-statistics is 0.239714 and the p-value is…
Q: 5. The following data represent the number of packages of 5 popular brands of cigarettes sold by a…
A: Since you have asked multiple question, we will solve the first question for you. If you want any…
Q: consumer magazine wants to compare the lifetimes of ballpoint pens of three different types. The…
A: *Answer: The required calculation table :
Q: Use the following sample data set for # 48 - #50: 12, 10, 8, 5, 10, 5 49. Compute Variance. (SHOW…
A:
Q: The following are the shoe sizes (inches) of 20 female students in SMU Senior High School: 6.4 7 8.1…
A: Given that Let Xi denotes the shoes size of 20 females : Xi: 5, 6.4, 7, 8.1, 5.8, 7.5, 9, 8.5,…
Q: Calculate pooled variance from the following raw data: Group 2 4 Group 1 16 11 10 9 15 7 13 12 4 9.…
A: The mean of group 1and group 2 are,
Q: 4. A researcher conducts a study comparing two dif- ferent treatments with a sample of n = 16…
A: Given data for treatments isTreatment 1:-6,7,11,4,19,17,2,5,9,13,6,23,11,4,6,1Treatment…
Q: A university administrator wishes to know if there is a difference in average starting salary for…
A: (a) Hypothesis: H0:μ1-μ2=0 H1:μ1-μ2≠0 The test is two tailed. (b) Test statistic:…
Q: andom sample selected from the above population yielded the following data: 500 525 425 445 280 490…
A: Comment: As per the our company guidelines we are supposed to answer only three subparts. Kindly…
Q: A sociologist studying New York City ethnic groups wants to determine if there is a difference in…
A: The given dataset is: Country I Country II Country III Country IV 12.3 8.3 20.4…
Q: An analysis of variance produces SSbetween = 75 and MSbetween = 15. In this analysis, how many…
A: An analysis of variance produces SSbetween = 75 and MSbetween = 15. In this analysis, how many…
Q: 4 What is the Variance of Vendor A? 4 3.75 3.36 4.08
A: The answer is 3.36.
A university employment office wants to compare the time taken by graduates with three different majors to find their first full-time job after graduation. The following table lists the time (in days) taken to find their first full-time job after graduation for a random sample of eight business majors, seven computer science majors, and six engineering majors who graduated in May 2019.
find the values A to H
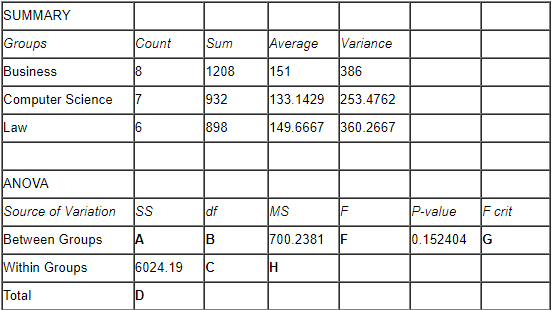
Step by step
Solved in 3 steps with 2 images
- A company implemented a new sales management software program, hoping it will reduce the amount of time sales people spend on their computers. A sample of sales personnel computer usage before and after the new software implementation is provided below (also available for download here Computer.xlsx). At a 1% level of significance, can you conclude that the new software has reduced the amount of time sales people spend on their computers? YOU CAN ASSUME THE POPULATION TO BE NORMALLY DISTRIBUTED. Time Spent on Computer Employee ID Before New Software (hrs/wk) After New Software (hrs/wk) 91416 2.5 2 99305 5 5 82797 2.5 2.5 30838 6 6.5 13294 5 5 26278 9 8 74905 10 10 82358 7.5 8.5 79299 11 10.5 10243 6.5 5.5 21362 2 1 52331 8.5 8 86984 4 4 58264 4.5 5 56656 6.5 6 14778 4 4 70413 8.5 8 71094 6 7 83598 11 12 97170 3 3 20813 11 11 67218 8.5 8.5 24945 5.5 4.5 92186 3 3 84339 5 4 89381 6.5 6 41627 5.5 4.5 84214 10 9 98679 2 3…The table below shows the estimated vaccination coverage of adolescents aged 13-17 years, as reported in national surveys in 2020 and 2021. Vaccine Percent vaccinated (95% CI) Tdap (tetanus, diphtheria, and acellular pertussis vaccine) 2020: 90.1 (89.2–90.9) 2021: 89.6 (88.6–90.5) MMR (measles, mumps, and rubella vaccine) 2020: 92.4 (91.6–93.2) 2021: 92.2 (91.2–93.2) HPV (human papillomavirus vaccine) 2020: 58.6 (57.3–60.0) 2021: 61.7 (60.2–63.2) Answer these: a. For which vaccine(s) was there a statistically significant change in coverage from 2020 to 2021? For each, note whether it was a statistically significant increase or decrease? b. For which vaccine(s) was there no significant change in coverage from 2020 to 2021?A customer relations manager is interested to know how long it takes for customers to fill out extended warranty forms for a particular product. Data below shows the time to fill out the forms by 11 customers. Test, at 5% level, whether the median time to fill out the forms exceeds 3 minutes. Customer Fill Time (minutes) 1 3.7 2 2.8 3 3.2 4 3.9 5 4.4 6 3.1 7 3.5 8 5.4 9 3 10 3.7 11 4.5 State the hypotheses. What statistical test should be used to determine if the median time to fill out the forms exceeds 3 minutes.? Set up the decision rule. (α=0.05) Compute the test statistic and find the p-value. Interpret your results. Give your conclusion.
- A pharmaceutical company wants to know whether an experimental drug has an effect on systolic blood pressure. Fifteen randomly selected subjects were given the drug and, after sufficient time for the drug to have an impact, their systolic blood pressures were recorded. The data appear below: 172140123130115 148108129137161 123152133128142172140123130115 148108129137161 123152133128142 Calculate the values of y¯¯¯y¯ and s for the 15 blood pressure readings.The following table shows the assessed values and the selling prices of eight houses, constituting a random sam-ple of all the houses sold recently in a metropolitan area: Assessed value Selling price(thousands) (thousands)(of dollars) (of dollars)170.3 214.4202.0 269.3162.5 206.2174.8 225.0157.9 199.8181.6 232.1210.4 274.2188.0 243.5 (a) Fit a least squares line that will enable us to predictthe selling price of a house in that metropolitan area interms of its assessed value. (b) Test the null hypothesis β = 1.30 against the alterna-tive hypothesis β > 1.30 at the 0.05 level of significance.The data in the table below presents the hourly quantity of production for three lines of productionprocesses over the first 4 days in XYZ Company. Answer the questions based on the Excel Output givenbelow.Day Process 1 Process 2 Process 31 33 33 282 30 35 363 28 30 304 29 38 34ANOVA: Single FactorSUMMARYGroups Count Sum Average VarianceProcess 1 4 120 30 4.66667Process 2 4 136 34 11.3333Process 3 4 128 32 13.3333ANOVASource of Variation SS df MS F P valueBetween Groups 32 ? ? ?Within Groups 88 ? ?Total 120 11 State the null and alternative hypothesis for single factor ANOVA.
- Studies have shown that omega-3 fatty acids have a wide variety of health benefits. Omega-3 oils can be found in foods such as fish, walnuts, and flaxseed. A company selling milled flaxseed advertises that one tablespoon of the product contains, on average, at least 3800 mg of ALNA, the primary omega-3. a) The company plans to conduct a test to ensure that there is sufficient evidence that its claimiscorrect. Tobesafe,thecompanywantstomakesurethatevidenceshowsthe average is higher than 3800 mg. What are the null and alternative hypotheses? b) Suppose, instead, that a consumer organization plans to conduct a test to see if there is evidence against the claim that the product contains an average of 3800 mg per tablespoon. The consumer organization will only take action if it finds evidence that the claim made by the company is false and that the actual average amount of omega-3 is less than 3800 mg. What are the null and alternative hypotheses?Are you an impulse shopper? A survey of 1000 grocery shoppers indicated that 24% of males and 57%of females make an impulse purchase every time they shop. Assume that the survey consisted of 500 males and 500 females. Complete parts (a) and (b) below. Question content area bottom Part 1 a. At the 0.01 level of significance, is there evidence of a difference in the proportion of males and females who make an impulse purchase every time they shop? Let group 1 be the males, and let group 2 be the females. State the null and alternative hypotheses. Choose the correct answer below. A. H0:π1≥π2 H1:π1<π2 BH0:π1≠π2 H1:π1=π2 C.H0:π1≤π2 H1:π1>π2 D.H0:π1=π2 H1:π1≠π2 E.H0:π1<π2 H1:π1≥π2 F.H0:π1>π2 H1:π1≤π2 Part 2 Calculate the test statistic. χ2STAT= (Round to three decimal places as needed.) Part 3 Determine the critical value. The critical value is - (Round to three decimal places as needed.) Part 4 State…The British Department of Transportation studied to see if people avoid driving on Friday the 13th. They did a traffic count on a Friday and then again on a Friday the 13th at the same two locations. The data for each location on the two different dates is in the table. Do the data show that on average fewer people drive on Friday the 13th? Test at the 5% level.Traffic Count Dates 6th 13th 1990, July 137669 135825 1990, July 129699 128891 1991, September 136898 138275 1991, September 138966 139940 1991, December 132021 129640 1991, December 119268 119214 1992, March 131938 131104 1992, March 123306 124760 1992, November 129499 129219 1992, November 138568 135934
- Jensen Tire & Auto is in the process of deciding whether to purchase a maintenance contract for its new computer wheel alignment and balancing machine. Managers feel that maintenance expense should be related to usage, and they collected the following information on weekly usage (hours) and annual maintenance expense (in hundreds of dollars). Weekly Usage(hours) AnnualMaintenanceExpense 13 17.0 10 22.0 20 30.0 28 37.0 32 47.0 17 30.5 24 32.5 31 39.0 40 51.5 38 40.0 test statistic is 6.90 Find the p-value. (Round your answer to three decimal places.) p-value = State your conclusion. Reject H0. We conclude that the relationship between weekly usage (hours) and annual maintenance expense (in hundreds of dollars) is significant. Do not reject H0. We conclude that the relationship between weekly usage (hours) and annual maintenance expense (in hundreds of dollars) is significant. Reject H0. We cannot conclude that the relationship between weekly usage…A researcher is concerned about the level of knowledge possessed by university studentsregarding United States history. Students completed a high school senior levelstandardized U.S. history exam. Major for students was also recorded. Data in terms ofpercent correct is recorded below for 32 students. Compute the appropriate test for thedata provided in Table 2. Compute the appropriate test using 5% significant level.TABLE 2Education Business/ManagementBehavioral/SocialScienceFine Arts62 72 42 8081 49 52 5775 63 31 8758 68 80 6467 39 22 2848 79 71 2926 40 68 6236 15 76 45a) What would be the null hypothesis in this study?b) What would be the alternate hypothesis?c) What is your Fcrit?d) Is there a significant difference between the groups?e) If there is a significant difference, where specifically are the differences?f) Interpret your answer.Listed below are the costs (in dollars) of flights between two cities for different airlines. Use a 0.05 significance level to test the claim that there is no difference in cost between flights scheduled one day in advance and those scheduled 30 days in advance. What appears to be a wise scheduling strategy? Flight scheduled one day in advance 429 613 620 1065 946 574 536 Flight scheduled 30 days in advance 237 262 270 251 289 312 280 Find the null and alternative hypotheses. Find the test statistic. x=enter your response here Find the critical value. The critical value is enter your response here.