SUMMARY OUTPUT Regression Statistics Multiple R 0.303005183 R Square 0.091812141 Adjusted R Square 0.05937686 Standard Error 8.538049739 Observations 30 ANOVA Significance F df Regression 1. 206.3477865 206.347787 2.83062575 0.103603045 Residual 28 2041.152213 72.8982933 Total 29 2247.5 t Stat Coefficients Standard Error P-value Lower 95% Upper 95% Lower 95.0% Upper 95.0% Intercept 1.872650091 8.248361046 0.22703299 0.82204756 -15.02335158 18.7686518 -15.02335158 18.76865177 #Flashdrives 1.937537902 1.15161942 1.68244636 0.10360305 -0.421447544 4.29652335 -0.421447544 4.296523347


Correlation
Correlation defines a relationship between two independent variables. It tells the degree to which variables move in relation to each other. When two sets of data are related to each other, there is a correlation between them.
Linear Correlation
A correlation is used to determine the relationships between numerical and categorical variables. In other words, it is an indicator of how things are connected to one another. The correlation analysis is the study of how variables are related.
Regression Analysis
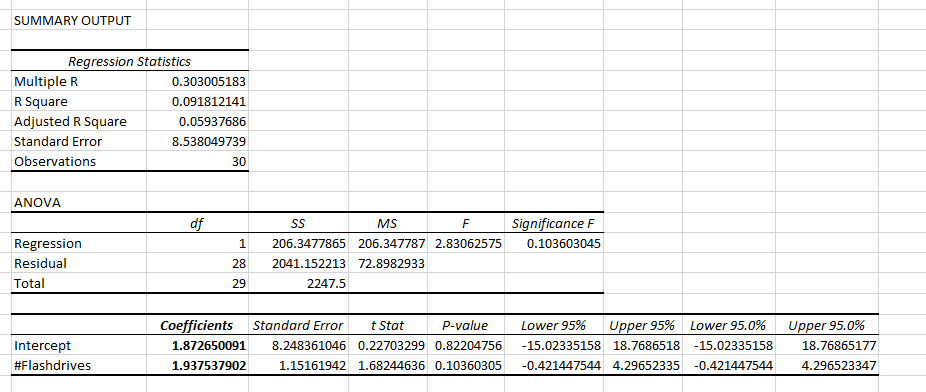
Regression analysis is a statistical method in which it estimates the relationship between a dependent variable and one or more independent variable. In simple terms dependent variable is called as outcome variable and independent variable is called as predictors. Regression analysis is one of the methods to find the trends in data. The independent variable used in Regression analysis is named Predictor variable. It offers data of an associated dependent variable regarding a particular outcome.
The following presents a sample of the number of defective flash drives produced by a small manufacturing company over the last 30 weeks.
Present an analysis of these regression results. What do they mean? Why is it important?


Trending now
This is a popular solution!

Step by step
Solved in 2 steps with 1 images


