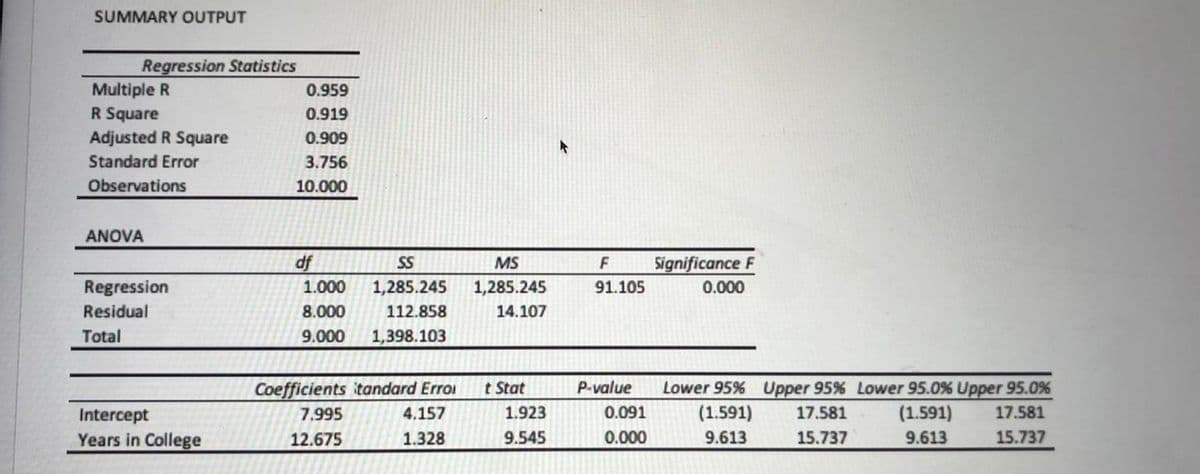
SUMMARY OUTPUT Regression Statistics Multiple R R Square Adjusted R Square 0.959 0.919 0.909 Standard Error 3.756 Observations 10.000 ANOVA df SS MS F Significance F Regression Residual Total 1.000 1,285.245 1,285.245 91.105 0.000 8.000 112.858 14.107 9.000 1,398.103 Coefficients itandard Erroi 7.995 t Stat P-value Lower 95% Upper 95% Lower 95.0% Upper 95.0% (1.591) 1.923 0.091 17.581 (1.591) 17.581 ntercept Years in College 4.157 12.675 1.328 9.545 0.000 9.613 15.737 9.613 15.737


Q: Treatment Sham μ μ1 μ2 n 25 25 x 0.55 0.43 s 0.78 1.42 a. Use a 0.05…
A: State the hypotheses. (a) That is, there is no evidence to conclude that those treated with magnets…
Q: The null hypothesis: Н = 0 The alternative hypothesis: H 1 :B, 1 Degrees of freedom: The type of…
A:
Q: Quality of Life Experienced by Women and Men (N = 171) WOMEN (n = 74) MEAN (SD) TABLE VI MEN (n= 97)…
A: Assumptions for the t-test are: 1) The scale of the measurement applied to the collected data should…
Q: Target MELCS: Solves problems involving test of hypotheses on the population me. dentifies the…
A:
Q: Response 1 2 3 Yes 150 150 96 No 100 150 104 ere pi is the population proportion of yes responses…
A: Solution: Given information: k= 3 categories n1= 250 Sample size of population 1n2= 300 Sample…
Q: Analysis of Variance Source df MS Between samples 722.7 4 180.68 15.3 Within samples 473.3 40 11.84…
A:
Q: deviation of waiting times at the same bank when separate waiting lines are used at each teller…
A:
Q: Sample Variance State the null and alternative hypotheses. Ho : oO H : o> Calculate the value of the…
A: It is given that For current method, sample size n1 = 41, sample variance s12 = 21 For new method,…
Q: Regression. A coach wants to see the relationship between the statistics of practice games and…
A:
Q: Data set 27 “M&M” weights in Appendix B lists data from 100 M&Ms and 27% of them are blue. The Mars…
A: To make inference regarding population proportion z-hypothesis test can be used. This hypothesis…
Q: Part 1 Use a t-test to test the claim about the population mean μ at the given level of…
A: We have given that Sample mean=23.2, Sample standard deviation s=4.3, Sample size n=15
Q: Sample Sample size Sample variance 1 N1 = 11 s = 12 %3D 2 n2 = 8 s = 23 i. Find the test statistic F…
A: The provided sample variances are s12=12s_1^2 = 12 and s22=23s_2^2 = 23 and the sample sizes are…
Q: Refer to the ANOVA table for this regression. Source SS d.f. MS Regression 1,028,994 15 68,600…
A: From the given information, Source SS d.f. MS Regression 1,028,994 15 68,600…
Q: I am stuck on the question below. I have been able to figure out everything down to the last part. I…
A: Test whether the population proportion of customers who wait for less than 5 minutes for service is…
Q: One assumption underlying linear regression is that for each value of x, there are corresponding y…
A: The assumption of the linear regression are defined as: 1) The regression model is linear in…
Q: A random sample of 11 items is drawn from a population whose standard deviation is unknown. The…
A: It is given that the sample mean and standard deviation are 810 and 20, respectively. The sample…
Q: Repeated measures AnOVA A therapist interestedin helping individuals with Ophidiophobia. In order…
A: One way anova
Q: Remaining Time: 1 hour, 50 minutes, 39 seconds. Question Completion Status: A Moving to another…
A: Note: Since you have posted multiple independent questions in the same request, we will solve the…
Q: n 10 8 We want to test the hypothesis that population B has a smaller variance than population A.…
A: We have to test that B have lower variance than A ,we will use F test for variance
Q: A measure of goodness of fit for the estimated regression equation is the a) sample size b) multiple…
A: The mean square due to error determines how the data points are closer to the fitted regression…
Q: Gas Guzzlers. The magazine Consumer Reports publishes information on automobile gas mileage and…
A: a. Obtain the standard error of the estimate and interpret. The lot sizes and assessed value for a…
Q: True OR False Data that exhibit an autocorrelation effect violate the regression assumption of…
A: Answer: 1. True 2. False
Q: Target Topic: Similarity in terms of the average systolic blood pressure between male and female…
A: The provided information is x¯1=119, x¯2=115σ1=11.9, σ2=10.5n1=45, n2=40α=0.05a.The null and…
Q: Golden Torch Cacti Lengths. Another variable Feldman and Crosswhite investigated in their study of…
A: The information is the total length of the golden torch cacti lengths. Hypotheses: For main effect…
Q: Sample variance 6.00 a. At the a= 0.05 level of significance, can we reject the null hypothesis that…
A: Hello! As you have posted more than 3 sub parts, we are answering the first 3 sub-parts. In case…
Q: Model N Мean Median Tri.Mean Std Dev S.E. Mean Hyundai Тoyota 23 109 135 107.64 * 1.34 27 165 124…
A: It is an important part of statistics. It is widely used.
Q: Q3. p-values and confidence intervals provide the same type of statistical information. True or…
A: Given that Q3. p-values and confidence intervals provide the same type of statistical…
Q: you are required to test the 5% level of significance the hypothesis that the average monthly…
A: Given : Model N Mean Median Tri.Mean Std Dev S.E. Mean Hyundai 23 109 135 107.64 * 1.34…
Q: GROUPED DATA- MEASURES OFCENTRAL TENDENCY 2. The table below gives the frequency distribution of the…
A:
Q: Multiple R 09161 R Square 0.8392 Adjusted R Square 0 8109 Standard Error 20.1451 Observations 21…
A: Solution The given output is regression output of a regression model computed by Excel.
Q: A community college institutional researcher wants to analyze a data set with age (in years)…
A: We use a Regression test.
Q: se the following ANOVA table for regression to answer the questions. Response: Y Source DF Sum Sq…
A: Given information: Source DF Sum Sq Mean Sq F-value Pr(>F) Regression 1 10.964 10.964 3.02…
Q: 2) The total expenses of a hospital are related to many factors. Two of these factors are the number…
A: (a) The regression equation in three variables (of which one is dependent and other two are…
Q: PERFORMANCE TASK Complete the table then answer what is asked. Ages of Teachers in Zambales National…
A: The following formulas can be used to complete the table: 1.Mid point = (lower class limit + upper…
Q: Root_lenght Treatment Root_lenght Treatmen t control 3dS 6dS 9dS 12dS Total Case Processing Summary…
A: Box plot is used to measure the normality or skewness of the data set. Box plot calculated using the…
Q: Method p: event proportion Exact method is used for this analysis. Descriptive Statistics N…
A: From the given information we find the solution using z test for proprtion.
Q: h v sample mean а. Ро coefficient of determination b. N С. C. s2 d population standard deviation d.…
A: Titles Notation sample standard deviation (f) sample size (q) mean of sampling distribution of…
Q: Sampling Distributons pet x TEO MH O urses/42741/assignments/442892 Show Attempt History Current…
A: The provided figure depicts that the distribution of sample proportion is normally distributed.…
Q: Hypothesis Test for Difference in Population Means (o Unknown) You wish to test the following claim…
A: We have given that Sample sizes n1=10 , n2= 26 Standard deviation s1= 12.8 , s2= 20.3 level of…
Q: Source Corrected Model Intercept Treatment Type Treatment Type Error Total Tests of Between-Subjects…
A: Given Information: Consider the given SPSS output:
Q: Critical values rejection region standardized test statistics reject or fail
A:
Q: Hypothesis test results: u: Mean of variable Ho : µ= 2.3 HA : µ> 2.3 Variable | Sample Mean Length…
A: Given Information: Population mean (u) = 2.3
Q: 2) Data were collected to explain the an employee's annual income raise (expressed in S's) based on…
A: The tables in the question can be completed as follows. Given that, Sum of squares due to…
Q: Treatment II III 2 N = 24 G = 72 EX2 = 292 3 M = 2 M = 3 T = 16 T= 24 T= 32 SS = 16 SS = 24 SS = 20…
A: Note: Hey there! Thank you for the question. In your question, it is mentioned that “determine…
Q: Before After 430 465 475 485 520 535 360 410 440 425 Sos 425 450 470 480 S15 430 520 430 450 460 500…
A: It is a one-tailed test The following data is provided: Pair Sample 1 = Before Sample 2 = After…
Q: The Normal Distribution Activity For Data Set 2 Mean = 2.000 Variance = 4.5263 Standard Deviation =…
A: Given Information: Mean μ=2 Standard deviation σ=2.1275 7) To sketch the normal curve showing the…
Q: Midterms Activity No. 1: Introduction to Statistics Name: CYS: Date: 1. Identify each of the…
A: “Since you have asked multiple questions, we will solve the first question for you. If you want any…
Q: Cigarette Smoking A researcher found that a cigarette smoker smokes on average 31 cigarettes a day.…
A: The random variable X follows normal distribution. We have to test whether the mean is less than 31…
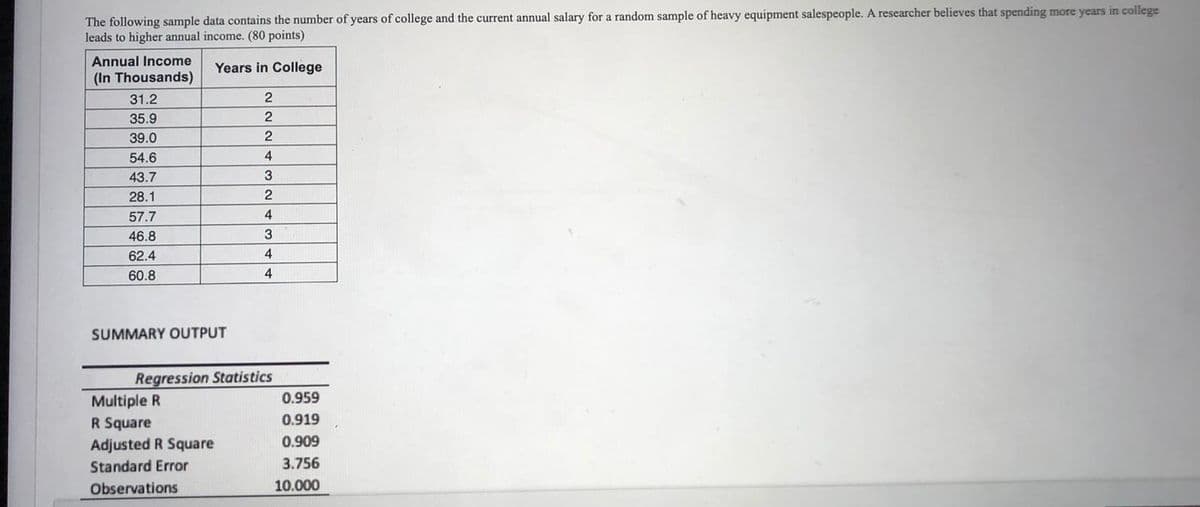
what is the value of intercept? how to interpret the meaning of intercept?

Step by step
Solved in 2 steps with 2 images

- GreenLawns provides a lawn fertilizer and weed control service. The company is adding a special aeration treatment as a low-cost extra service option, which it hopes will help attract new customers. Management is planning to promote this new service in two media: radio and direct-mail advertising. A media budget of $3,500 is available for this promotional campaign. Based on past experience in promoting its other services, GreenLawns obtained the following estimate of the relationship between sales and the amount spent on promotion in these two media. S = −2R2 − 10M2 − 8RM + 18R + 34M where S = total sales in thousands of dollars R = thousands of dollars spent on radio advertising M = thousands of dollars spent on direct-mail advertising. GreenLawns would like to develop a promotional strategy that will lead to maximum sales subject to the restriction provided by the media budget. (a) What is the value of sales (in dollars) if $2,500 is spent on radio advertising and $1,000 is…The Bureau of Labor Statistics gathers data about employment in the United States. A sample is taken to calculate the number of U.S. citizens working in one of several industry sectors over time. Table 11.16 shows the results: Industry Sector 2000 2010 2020 TotalNonagriculture wage and salary 13,243 13,044 15,018 41,305Goods-producing, excluding agriculture 2,457 1,771 1,950 6,178Services-providing 10,786 11,273 13,068 35,127Agriculture, forestry, fishing, and hunting 240 214 201 655Nonagriculture self-employed and unpaid family worker 931 894 972 2,797Secondary wage and salary jobs in agriculture and private householdindustries 14 11 11 36Secondary jobs as a self-employed or unpaid family worker 196 144 152 492Total 27,867 27,351 31,372 86,590 Table 11.16 We want to know if the change in the number of jobs is independent of the change in years. State the null and alternative hypotheses and the degrees of freedom.Food deserts have become a particularly hot topic in the public health community as an explanation for a variety of negative health outcomes in disadvantaged areas. A researcher is interested in comparing the average shelf space provided by supermarkets, convenience stores, and corner stores in two different communities in order to address the growing concern for food deserts. Assume the following table reports the summary statistics for shelf space dedicated to fresh fruits and vegetables (meters) from SRSs of a variety of different stores that supply groceries from each community. Community Average shelf space for fresh fruits and vegetables (m) Sample standard deviation Sample size "Food desert" 13.7 2.4 12 Other community 89.4 14.6 14 A) Carry out the appropriate statistical test in order to determine if there is a significantdifference in mean shelf space between the two communities at the alpha level of 0.05. Assumeall conditions for the test are met. Do not assume…
- Several methods of estimating the number of seeds in soil samples have been developed by ecologists. An article gave the accompanying data on the number of seeds detected by the direct method and by the stratified method for 27 soil specimens. Specimen Direct Stratified 1 23 8 2 34 39 3 0 8 4 60 59 5 20 54 6 63 63 7 40 28 8 8 8 9 14 8 10 94 100 11 3 0 12 68 59 13 79 68 14 23 54 Specimen Direct Stratified 15 34 28 16 0 0 17 39 39 18 19 14 19 94 94 20 3 14 21 40 48 22 23 23 23 0 0 24 8 14 25 14 40 26 19 14 27 40 79 Do the data provide sufficient evidence to conclude that the mean number of seeds detected differs for the two methods? Test the relevant hypotheses using ? = 0.05. (Use ?direct − ?stratified.) Find the test statistic. (Round your answer to two decimal places.) t = Find the df. (Round your answer down to the nearest whole number.) df = Use technology to find the P-value. (Round your answer to four…23.Food deserts have become a particularly hot topic in the public health community as an explanation for a variety of negative health outcomes in disadvantaged areas. A researcher is interested in comparing the average shelf space provided by supermarkets, convenience stores, and corner stores in two different communities in order to address the growing concern for food deserts. Assume the following table reports the summary statistics for shelf space dedicated to fresh fruits and vegetables (meters) from SRSs of a variety of different stores that supply groceries from each community. Community Average shelf space for fresh fruits and vegetables (m) Sample standard deviation Sample size "Food desert" 13.7 2.4 12 Other community 89.4 14.6 14 23.Food deserts have become a particularly hot topic in the public health community as an explanation for a variety of negative health outcomes in disadvantaged areas. A researcher is interested in comparing the average shelf space…Chest Injury Rating Car Driver Passenger Car Driver Passenger 1 42 35 10 36 37 2 42 35 11 36 37 3 34 45 12 43 58 4 34 45 13 40 42 5 45 45 14 43 58 6 40 42 15 37 41 7 42 46 16 37 41 8 43 58 17 44 57 9 45 43 18 42 42 Generate test results (α = .01) using data analysis (EXCEL).
- 2. In the article “Case Adaptation Method of CaseBased Reasoning for Construction Cost Estimation in Korea” (J. Constr. Engr. Mgmt., 2012: 43–52) provided data on military barrack projects undertaken by the Korean Ministry of National Defense from 2004 to 2008. Two variables of interest were the floor area of a barrack and the corresponding cost (in $US). The corresponding data is given in the attached image: a. Construct stem and leaf displays of both floor area and cost. Explain it.b. Do the values of cost appear to be perfectly linearly related to the floor area values? c. Construct a scatterplot of the data. Does it appear that cost could be accurately predicted by the value of floor area? Explain reasoning.In a manufacturing plant a work center is a specific production facility that consists of one or more people and or machines and is treated as one unit for the purposes of capacity requirements for planning and job scheduling. If jobs arrive at a work center faster than they depart the work center impedes overall productions and is referred to as a bottleneck. The data below was collected by a plant manager for use in investigating a potential bottleneck work center. Construct a histogram for each data set. Do your histograms suggest that the work center may be a bottleneck? Explain. Number of Items Arriving at Work Center per Hour: 155 115 156 150 159 163 172 143 159 166 148 175 151 161 138 148 129 135 140 152 139 Number of Items Departing Work Center per Hour: 156 109 127 148 135 119 140 127 115 122 99 106 171 123 135 125 107 152 111 137 1612.Tuition Fees: The following table shows the average annual tuition and fees at private andpublic 4-year colleges and universities for the school years 2009-2010 through 2014-2015. Year Private Public2009-2010 31,448 15,0142010-2011 32,617 15,9182011-2012 33,674 16,8052012-2013 35,074 17,4742013-2014 36,193 18,3722014-2015 37,385 19,203a. Using 1 for 2009-2010, 2 for 2010-2011, and so on, find the linear correlationcoefficient and the equation of the least-squares line for the tuition and fees at private 4-year colleges and universities, based on the year. Don Honorio Ventura State University Pasig, Candaba, Pampanga MMW103: Mathematics in the Modern Worldb. Using 1 for 2009-2010, 2 for 2010-2011, and so on, find the linear correlationcoefficient and the equation of the least-squares line for the tuition and fees at public 4-year colleges and universities, based on the year.c. Based on the linear correlation coefficients you found in parts a and b, are theequations you wrote in parts…
- Location Basel Basel Basel lat 47.546944 47.546944 47.546944 lon 7.568918 7.568918 7.568918 asl 283.69672 283.69672 283.69672 variable Wind Speed Wind Speed Wind Speed unit km/h km/h km/h level 10 m 10 m 10 m resolution daily daily daily aggregation Maximum Minimum Mean timestamp Basel Wind Speed [10 m] Basel Wind Speed [10 m] Basel Wind Speed [10 m] 2022-12-20T00:00:00 18.681883 5.7599998 11.791341 2022-12-21T00:00:00 35.652725 3.2399998 16.304209 2022-12-22T00:00:00 37.11319 18.079027 26.106277 2022-12-23T00:00:00 37.57993 15.379206 27.482597 2022-12-24T00:00:00 23.157824 5.3999996 12.934727 2022-12-25T00:00:00 15.807239 7.289445 12.189437 2022-12-26T00:00:00 24.923338 3.8773184 13.438794 2022-12-27T00:00:00 23.664352 0.35999998 6.766806 2022-12-28T00:00:00 16.75064 0.35999998 10.514861 2022-12-29T00:00:00 26.009842 7.2 17.154203 For your data, use the linear forecasting model which is y = mx + c to calculate and discuss the followings:…apply visual and descriptive analytics to summarize the data for italy. Use this to draw any initial conclusion date total_cases new_cases total_deaths new_deaths 12/31/2019 0 0 0 0 1/1/2020 0 0 0 0 1/2/2020 0 0 0 0 1/3/2020 0 0 0 0 1/4/2020 0 0 0 0 1/5/2020 0 0 0 0 1/6/2020 0 0 0 0 1/7/2020 0 0 0 0 1/8/2020 0 0 0 0 1/9/2020 0 0 0 0 1/10/2020 0 0 0 0 1/11/2020 0 0 0 0 1/12/2020 0 0 0 0 1/13/2020 0 0 0 0 1/14/2020 0 0 0 0 1/15/2020 0 0 0 0 1/16/2020 0 0 0 0 1/17/2020 0 0 0 0 1/18/2020 0 0 0 0 1/19/2020 0 0 0 0 1/20/2020 0 0 0 0 1/21/2020 0 0 0 0 1/22/2020 0 0 0 0 1/23/2020 0 0 0 0 1/24/2020 0 0 0 0 1/25/2020 0 0 0 0 1/26/2020 0 0 0 0 1/27/2020 0 0 0 0 1/28/2020 0 0 0 0 1/29/2020 0 0 0 0 1/30/2020 0 0 0 0 1/31/2020 3 3 0 0 2/1/2020 3 0 0 0 2/2/2020 3 0 0 0 2/3/2020 3 0 0 0 2/4/2020 3 0 0 0 2/5/2020 3 0 0 0 2/6/2020 3 0 0 0 2/7/2020 3 0 0 0 2/8/2020 3 0 0 0 2/9/2020 3 0 0 0 2/10/2020 3 0 0 0 2/11/2020…A statistics professor would like to build a model relating student scores on the first test to the scores on the second test. The test scores from a random sample of 2121 students who have previously taken the course are given in the table. Test Scores Student First Test Grade Second Test Grade 1 8989 7777 2 6060 7373 3 5252 6767 4 4444 6262 5 7474 7373 6 6969 7171 7 4343 6363 8 8080 7878 9 4747 6161 10 7676 7878 11 6565 7575 12 8989 7878 13 7878 7777 14 9696 8181 15 5252 6161 16 9393 8585 17 9090 8080 18 6767 6969 19 4343 6060 20 4848 6161 21 4646 6161 Copy Data Step 1 of 2: Using statistical software, estimate the parameters of the model Second Test Grade=β0+β1(First Test Grade)+εiSecond Test Grade=β0+β1(First Test Grade)+εi. Enter a negative estimate as a negative number in the regression model. Round your answers to 4 decimal places, if necessary.
