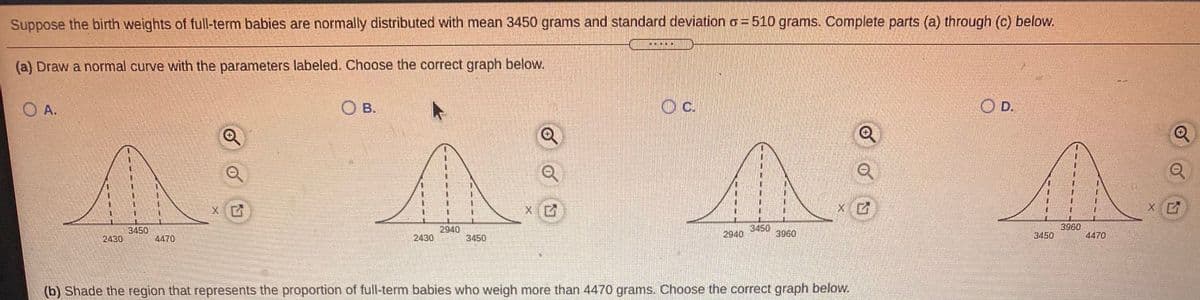
Suppose the birth weights of full-term babies are normally distributed with mean 3450 grams and standard deviation o = 510 grams. Complete parts (a) through (c) below. .... (a) Draw a normal curve with the parameters labeled. Choose the correct graph below. O A. OB. Oc. D. 2940 2430 3450 2940 3450 3960 3960 3450 3450 4470 2430 4470


Q: Using the standard normal distribution table, compute the following probabilities P(Zs2.5) is: .9599…
A:
Q: Use the following information to answer question. n= 6, Σx= 16, Σx2 = 98. The standard deviation S…
A: (1) The provided information are: n=6,Σx=16,Σx2=98
Q: Which one of the following statements is not true as OLS assumptions? O a. The variance of the…
A: Option b is the correct assumption as the residual term should have an expected mean zero for the…
Q: The expected value of a random variable X that is denoted by u is called its: O a. median. O b.…
A: In statistics, expected value is the mean value of the data given. It is denoted by E(X) for a…
Q: Suppose that a particular large hotel has 790 rooms. Furthermore, suppose that for weekend nights…
A: Here' the answer: The Z value is X-Mu / ( Sigma/sqrt(n)) , where n is the sample of 35 nights taken.…
Q: (a) Take a 30-question examination random variable x number of questions answered correctly Identity…
A: Discrete random number takes only integer, i.e., (no fraction and decimals number). It is countable…
Q: Consider the process where S0 = 0 and {ut : t ∈ Z} is an i.i.d. random variable with N(0,σ2). a)…
A: * SOLUTION :- (5) From given information the answer is provided as below
Q: The Graduate Management Admission Test (GMAT) is a standardized exam used by many universities as…
A: Hey champ,Welcome to this platform. Here you will get the answer with better quality in minimum…
Q: using 'standard Normal Table ' , calculate the following probabilities. 1. Pr(z 2.32) 3.pr(1.22…
A: The standard normal distribution (z distribution) is a normal distribution with a mean of 0 and a…
Q: The number of homes sold by a realtor during a month has the following probability distribution: 3.…
A: *SOLUTION :- *3)
Q: Under what conditions can the standard deviation be used to measure the relative risk of two…
A: A) The Standard deviation can be utilized to quantify the relative risk of two investments when the…
Q: According to the Intern al Pevenue Service, the mean tax refund for the year 2014 was $2800 Assu me…
A: Given that μ=2800σ=450 Use normal table to obtain the probabilities of different events occurring.
Q: Suppose that themean cost of domestic airfares in the United States is $399 per ticket, with a…
A: Mean cost of airlines = $399Standard deviation = $119 We have to find the cost of the highest 5%…
Q: The probability of type-l error is: O A. always the same as the probability of type-Il error.
A: We have to find the probability of type - l error .
Q: A farmer believes there is an equal chance that the next growing season will be abnormally rainy.…
A: “Since you have posted a question with multiple sub-parts, we will solve first three sub-parts for…
Q: The 2018 statistics shows that the average life expectancy of females in Canada has risen to 83.9…
A: As given Average Life Expectancy = 83.9 years Standard Deviation = 7.4 years minimum percentage of…
Q: or all parts of this question, assume that the log of GDP per capita is normally distributed with a…
A: Given Mean of log GDP per capita =8.7 Standard deviation =1.5 We have to calculate the value of…
Q: ou are given the following data on large business policyholders: Losses for each employee of a given…
A: Given: In part I given that ; μ =15 In Part III given that; a = 60 In Part IV given that ; v =8000
Q: ndard deviation of $5200. What is the probability of a randomly selected new graduate recei ween…
A: DISCLAIMER “Since you have asked multiple question, we will solve the first 3 subparts for you. If…
Q: A Las Vegas supermarket bakery must decide how many wedding cakes to prepare for the upcoming…
A: a. According to the given information: The calculation of number of spares to order:
Q: ppose you have two independent unbiased estimators of the same parameter, θ, say θandθ, with…
A: Suppose two independent unbiased estimators of the same parameter is θ: θ1 and θ2 V ar(θ1) = v1V…
Q: The weekly salary paid to employees of a small company that supplies part-time laborers averages…
A: Disclaimer: “Since you have asked multiple questions, we will solve the first three sub-part…
Q: 9 - When a distribution is positively skewed, e a) the tails are fatter than in a normal…
A: d) standard deviation overestimates the risk
Q: vo properties of the sample average is: 1-lt is a random variable, and 2-: O A. has a probability…
A: the correct answer is; B. has a probability distribution that is the same as for Y1 ,...,YN on…
Q: The mean of a certain normal distribution is equal to the standard deviation of the sample mean of a…
A: Given: Let μ be population meanμ be population mean σ be the population standard deviation Given:…
Q: Patients often have to wait beyond their time of appointment to be seen by their physician despite…
A: Relative frequency measures how often something is happening divided by all outcomes.
Q: 53. The annual demand for Prizdol, a prescription drugmanufactured and marketed by the NuFeel…
A: To simulate this problem, create a spreadsheet with the following values and formula: This will…
Q: The number of auto parts that a company produces follows a normal distribution. The company has two…
A: The normal distribution, also known as the Gaussian distribution, is a symmetrical probability…
Q: Suppose we know that average annual income for the population is u = $45,700 with a standard…
A: Average annual income = $46700 Standard deviation = $5000 The government wishes to offer the aid…
Q: Suppose X and Y are two dependent random variables. Let Z (3X - 2Y + 4) with the following set of…
A: A dependent variable represents a quantity whose value depends on how the independent variable is…
Q: Suppose that there is a risky bet that promises a 50-50 chance of winning of losing $3500 for…
A: Given the starting bet where there 50-50 chances of winning or losing 3500 . Which means there are…
Q: A courier company guarantees its customers that the average time to pick up their packages is 20…
A: Process capability index is a statistical tool that measures the ability of any process to produce…
Q: 3. Report the sample mean and standard deviationof the 52-week cost under each policy. Usingthe…
A: Given
Q: A survey of apartment prices in Lexington finds that prices are distributed normally with the mean…
A:
Q: a. A company produces lightbulbs whose life follows a normal distribution, with mean 1200 hours and…
A: a. Given:- Mean=1200 hours Standard deviation=250 hours To calculate:- Probability that lifetime…
Q: #8) Consider the following information about random variables X, Y, A, and B: µx=4 Ox= 6 µy= 8 Oy=…
A: (a) To find E(A) = μA Given: A = 0.4X + 0.6Y E(A) = E(0.4X + 0.6 Y) E(A) = E(0.4X) + E(0.6Y) E(A) =…
Q: The following table provides a probability distribution for the random variable r. Excel File:…
A: Hey champ, Welcome to this platform. Here you will get the answer with better quality in minimum…
Q: 1. What is the probability for the region -1.00 < z < 1.00? a. 0.3432 b. 0.6827 C. 0.8413 d. 0.1587…
A: Answer 1) P (- 1 < Z < 1) = P (Z < 1) - P (Z < - 1) P (Z < 1) = 0.8413 P (Z < -…
Q: Student body elections are coming up and there are a lot of options. There are 3 candidates for…
A: In our daily life, we may come across the situation of guessing some vents or outcomes. For example,…
Q: 1. It will costs the Philippines P2,500,000 to drill a natural gas well. Operating expenses will be…
A: Daily production = 260,000 cubic feet Selling price = 80 per 1,000 cubic feet Initial cost =…
Q: For all parts of this question, assume that the log of GDP per capita is normally distributed with a…
A: We h have given that Log of GDP per capita is normally distributed and means is 8.7 and the…
Q: A company has established that the relationship between the sales price for one of its products and…
A: It is given that, P = 75 – 0.1D Fixed cost = $1000 Variable cost = 30D Therefore, Total cost (TC) =…
Q: For all parts of this question, assume that the log of GDP per capita is normally distributed with a…
A: The standard normal variate (Z) is calculated by using the following formula: Z=X-μσ where, μ is…
Q: Suppose X is a random variable with possible values -2,3 and 1 and with respective probabilities…
A: Given: X P(X) -2 0.22 3 0.35 1 0.43
Q: A company sells its products to wholesalers in batches of 10 units only. The daily demand for its…
A: Demand Total revenue (X) Probability (P) 0 0 0.2 10 37.5 0.2 20 75 0.3 30 112.5 0.2 40…
Q: Only question #1. Little stuck.
A: We have been given the variable - number of people living in a household (X) - and the corresponding…
Q: A major credit card company has determined that the amount its customers charge on their accounts is…
A: Given: Population meanμ=2800Population standard deviationσ=200 Consider X be the random variable…


Trending now
This is a popular solution!

Step by step
Solved in 2 steps


- Subject: Economics 1. Suppose you have two independent unbiased estimators of the same parameter, θ, say θandθ, with different variances, v ∧ 1 ∧ 2 1 and v2. What linear combination, = cθ∧ 1θ∧ 1+ c2θ∧ 2 is the minimum variance unbiased estimator of θ?Suppose that the distribution of Uber rides around the quoted arrival time is normally distributed. Themean waiting time (relative to the quoted time) is 0, with a standard deviation of 3 minutes.a. Using the empirical rule, what percentage of rides arrive within 3 minutes of the mean (3 minutesbefore to 3 minutes after)?b. Graphically depict the area that would need to be calculated to determine the probability ofwaiting more than 4 minutes for a ride. Explain your graph.Suppose the relationship between Y and X is given by: Y = 3.1415 + 6X + error By how much does the expected value of Y change if X increases by 7.23 units? (Round your answer to two decimal places: ex: 123.45)
- In any year, the weather can inflict storm damage to a home. From year to year, thedamage is random. Let Y denote the dollar value of damage in any given year.Suppose that in 95% of the years Y = 0, but in 5% of the years Y = 20,000.a. What is the mean of the damage in any year?b. What is the standard deviation of the damage in any year?c. Consider an “insurance pool” of 100 people who homes are sufficientlydispersed so that, in any year, the damage to different homes can be viewed asindependently distributed random variables. What is the probability that ?exceeds $2000?(Ch 7) A large number of MBA applicants are given an aptitude test. Scores are normally distributed with a mean of 460 and standard deviation of 80. Now, we can apply inverse normal to find the top 2.5 percent of the applicants score at least about ____. a. 606 b. 600 c. 617 d. 646(Ch7) Historically, the default rate on a commercial loan is 20 percent. If a bank makes 100 commercial loans, what is the approximate probability that more than 25 loans will result in default? (hint: use the normal approximation to the binomial. And, by continuity correction, you should use 25.5 as the new cutoff.) Question 2Select one: a. 0.0668 b. 0.0838 c. 0.2000 d. 0.0336
- For all parts of this question, assume that the log of GDP per capita is normally distributed with a mean of 8.7 and standard devistion of 1.5Step 1 of 4: If the log of the world distribution of income is normaly distributed with a mean of 8.7 and a standard deviation of 1.5, what income indollars) marks the 90th percentile? KeypadAnswer A 71.325B 1.29C 41,253D 10.63Times for a surgical procedure are normally distributed. There are two methods.Method A has a mean of 28 minutes and a standard deviation of 6 minutes, whilemethod B has a mean of 32 minutes and a standard deviation of 4 minutes. (a)Which procedure is preferred if the procedure must be completed within 28minutes? (b) Thirty-eight minutes? (c) Thirty-six minutes? Explain your reasoningfully.Let X1, X2, X3, X4 have the joint probability density functionf(x1, x2, x3, x4) = (24e−(x1+x2+x3+x4), 0 < x1, x2, x3, x4 < ∞0, elsewhereLet Y1 = X1, Y2 = X2 − X1, Y3 = X3 − X2, Y4 = X4 − X3.(i) Using the change of variable technique, find the joint probability density functionof Y1, Y2, Y3, Y4(ii) Find the conditional distribution of Y4 given Y1, Y2, Y3
- According to a recent Wall Street Journal article, about 2% of new US car sales are electric vehicles (data from Edison Electric Institute reported by Jinjoo Lee, "Peak Oil? Not This Year. Or This Decade," January 9, 2021 pg. B12). Suppose a company has 111 employees who drive new cars (separately) to work each day. What is the probability that at least one of them will drive an electric car? Note:- Do not provide handwritten solution. Maintain accuracy and quality in your answer. Take care of plagiarism. Answer completely. You will get up vote for sure.The price for two tickets (including online service charges), a large popcorn, and two medium soft drinks at a sample of six theatre chains is as follows: $36.15 $31.00 $35.05 $40.25 $33.75 $43.00 (a) Compute the mean and median. (b) Compute the variance, standard deviation, and range. (c) Are the data skewed? If so, how? (d) Based on the results of (a) through (c), what conclusions can you reach concerning the cost of going to the movies?Suppose the market for auto insurance is made of up two types of buyers: high-risk and low-risk. Buyers’ willingness to pay (WTP) for auto insurance plans, and sellers’ willingness to accept (WTA) when selling plans to each type of buyer, are outlined in a photo Assume now that there is asymmetric information and that insurance companies do not knowhow risky an individual buyer is. In the face of this uncertainty, they determine that the probability that a “walk-in” is high-risk is 0.75. What is the minimum price sellers are willing to accept when selling aninsurance plan? At this price, will low- and high-risk buyers both be willing to purchase this insurance plan? Explain. Be sure the mention adverse selection in your answer. Returning to the conditions outlined in Q1, suppose that buyers of auto insurance (high- and low-risk) were offered a $1,000 subsidy to purchase coverage. This would raise their WTP by $1,000. Would the market for both insurance plans clear after the…