Suppose you are interested in knowing the monthly number of cookies eaten by children. You put child age, weight, household income, and a bunch of parental controls on the RHS. You consider children from birth to age 14. Your model does great from a predictive stand point with small residuals, except for the 0-6 months old crowd which basically eats no cookies and has big residuals. They you likely violated the
Suppose you are interested in knowing the monthly number of cookies eaten by children. You put child age, weight, household income, and a bunch of parental controls on the RHS. You consider children from birth to age 14. Your model does great from a predictive stand point with small residuals, except for the 0-6 months old crowd which basically eats no cookies and has big residuals. They you likely violated the

MATLAB: An Introduction with Applications
6th Edition
ISBN:9781119256830
Author:Amos Gilat
Publisher:Amos Gilat
Chapter1: Starting With Matlab
Section: Chapter Questions
Problem 1P

Related questions
Question
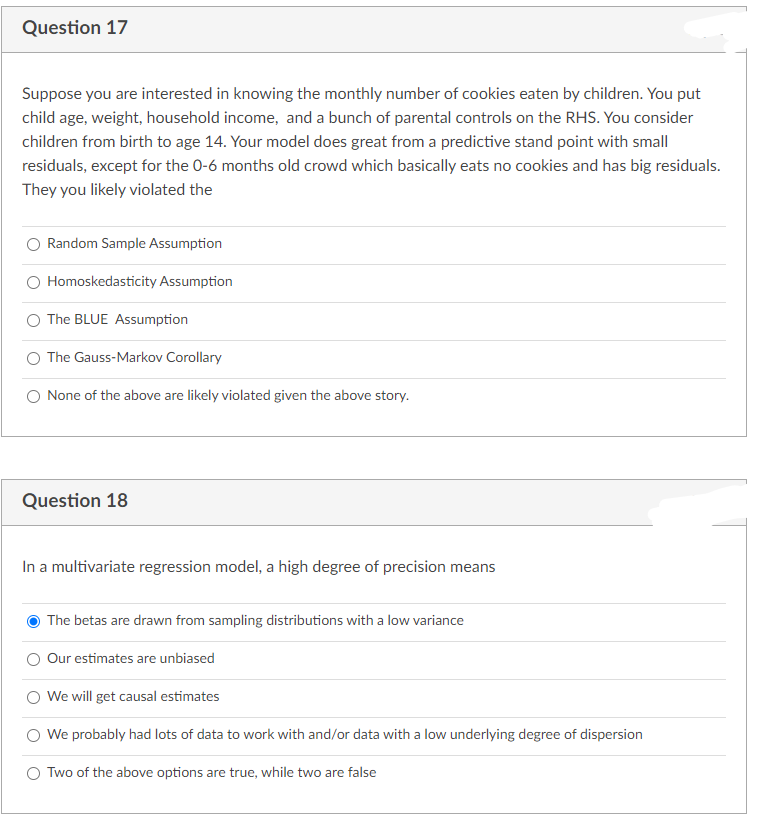
Transcribed Image Text:Question 17
Suppose you are interested in knowing the monthly number of cookies eaten by children. You put
child age, weight, household income, and a bunch of parental controls on the RHS. You consider
children from birth to age 14. Your model does great from a predictive stand point with small
residuals, except for the 0-6 months old crowd which basically eats no cookies and has big residuals.
They you likely violated the
Random Sample Assumption
Homoskedasticity Assumption
The BLUE Assumption
The Gauss-Markov Corollary
O None of the above are likely violated given the above story.
Question 18
In a multivariate regression model, a high degree of precision means
The betas are drawn from sampling distributions with a low variance
Our estimates are unbiased
We will get causal estimates
We probably had lots of data to work with and/or data with a low underlying degree of dispersion
Two of the above options are true, while two are false
Expert Solution
This question has been solved!
Explore an expertly crafted, step-by-step solution for a thorough understanding of key concepts.

This is a popular solution!

Trending now
This is a popular solution!

Step by step
Solved in 2 steps

Recommended textbooks for you
MATLAB: An Introduction with Applications
Statistics
ISBN:
9781119256830
Author:
Amos Gilat
Publisher:
John Wiley & Sons Inc

Probability and Statistics for Engineering and th…
Statistics
ISBN:
9781305251809
Author:
Jay L. Devore
Publisher:
Cengage Learning

Statistics for The Behavioral Sciences (MindTap C…
Statistics
ISBN:
9781305504912
Author:
Frederick J Gravetter, Larry B. Wallnau
Publisher:
Cengage Learning
MATLAB: An Introduction with Applications
Statistics
ISBN:
9781119256830
Author:
Amos Gilat
Publisher:
John Wiley & Sons Inc
Probability and Statistics for Engineering and th…
Statistics
ISBN:
9781305251809
Author:
Jay L. Devore
Publisher:
Cengage Learning
Statistics for The Behavioral Sciences (MindTap C…
Statistics
ISBN:
9781305504912
Author:
Frederick J Gravetter, Larry B. Wallnau
Publisher:
Cengage Learning

Elementary Statistics: Picturing the World (7th E…
Statistics
ISBN:
9780134683416
Author:
Ron Larson, Betsy Farber
Publisher:
PEARSON

The Basic Practice of Statistics
Statistics
ISBN:
9781319042578
Author:
David S. Moore, William I. Notz, Michael A. Fligner
Publisher:
W. H. Freeman

Introduction to the Practice of Statistics
Statistics
ISBN:
9781319013387
Author:
David S. Moore, George P. McCabe, Bruce A. Craig
Publisher:
W. H. Freeman