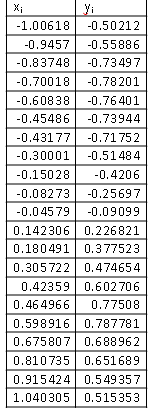
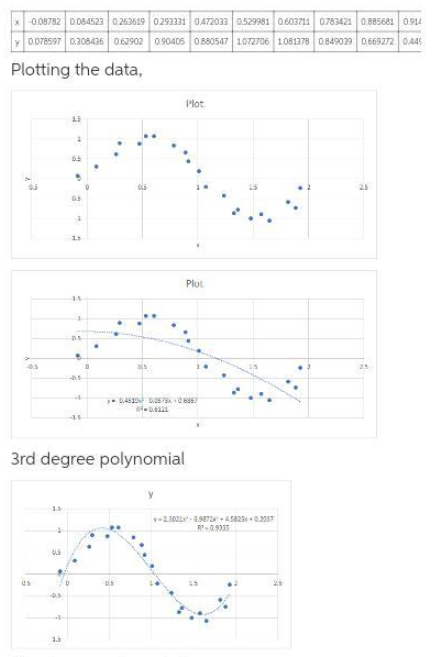
Use least squares regression to fit polynomials of order 1, 3 and 5 to the data given in table. Compute the correlation coefficient for each fit (Use Gauss elimination with partial pivoting in the solution of linear equation systems). Plot 1st, 3rd, and 5th order polynomial fits and the given discrete data. Comment on which of these curves explain better the variability of given data. I have a solution at second image but i dont understand where did the functions like "y=2.3021x^3+..." come from? I need a detailed description about it. Thank you


Correlation
Correlation defines a relationship between two independent variables. It tells the degree to which variables move in relation to each other. When two sets of data are related to each other, there is a correlation between them.
Linear Correlation
A correlation is used to determine the relationships between numerical and categorical variables. In other words, it is an indicator of how things are connected to one another. The correlation analysis is the study of how variables are related.
Regression Analysis
Regression analysis is a statistical method in which it estimates the relationship between a dependent variable and one or more independent variable. In simple terms dependent variable is called as outcome variable and independent variable is called as predictors. Regression analysis is one of the methods to find the trends in data. The independent variable used in Regression analysis is named Predictor variable. It offers data of an associated dependent variable regarding a particular outcome.
Use least squares regression to fit polynomials of order 1, 3 and 5 to the data given in table. Compute the
I have a solution at second image but i dont understand where did the functions like "y=2.3021x^3+..." come from? I need a detailed description about it. Thank you

Step by step
Solved in 3 steps with 2 images


