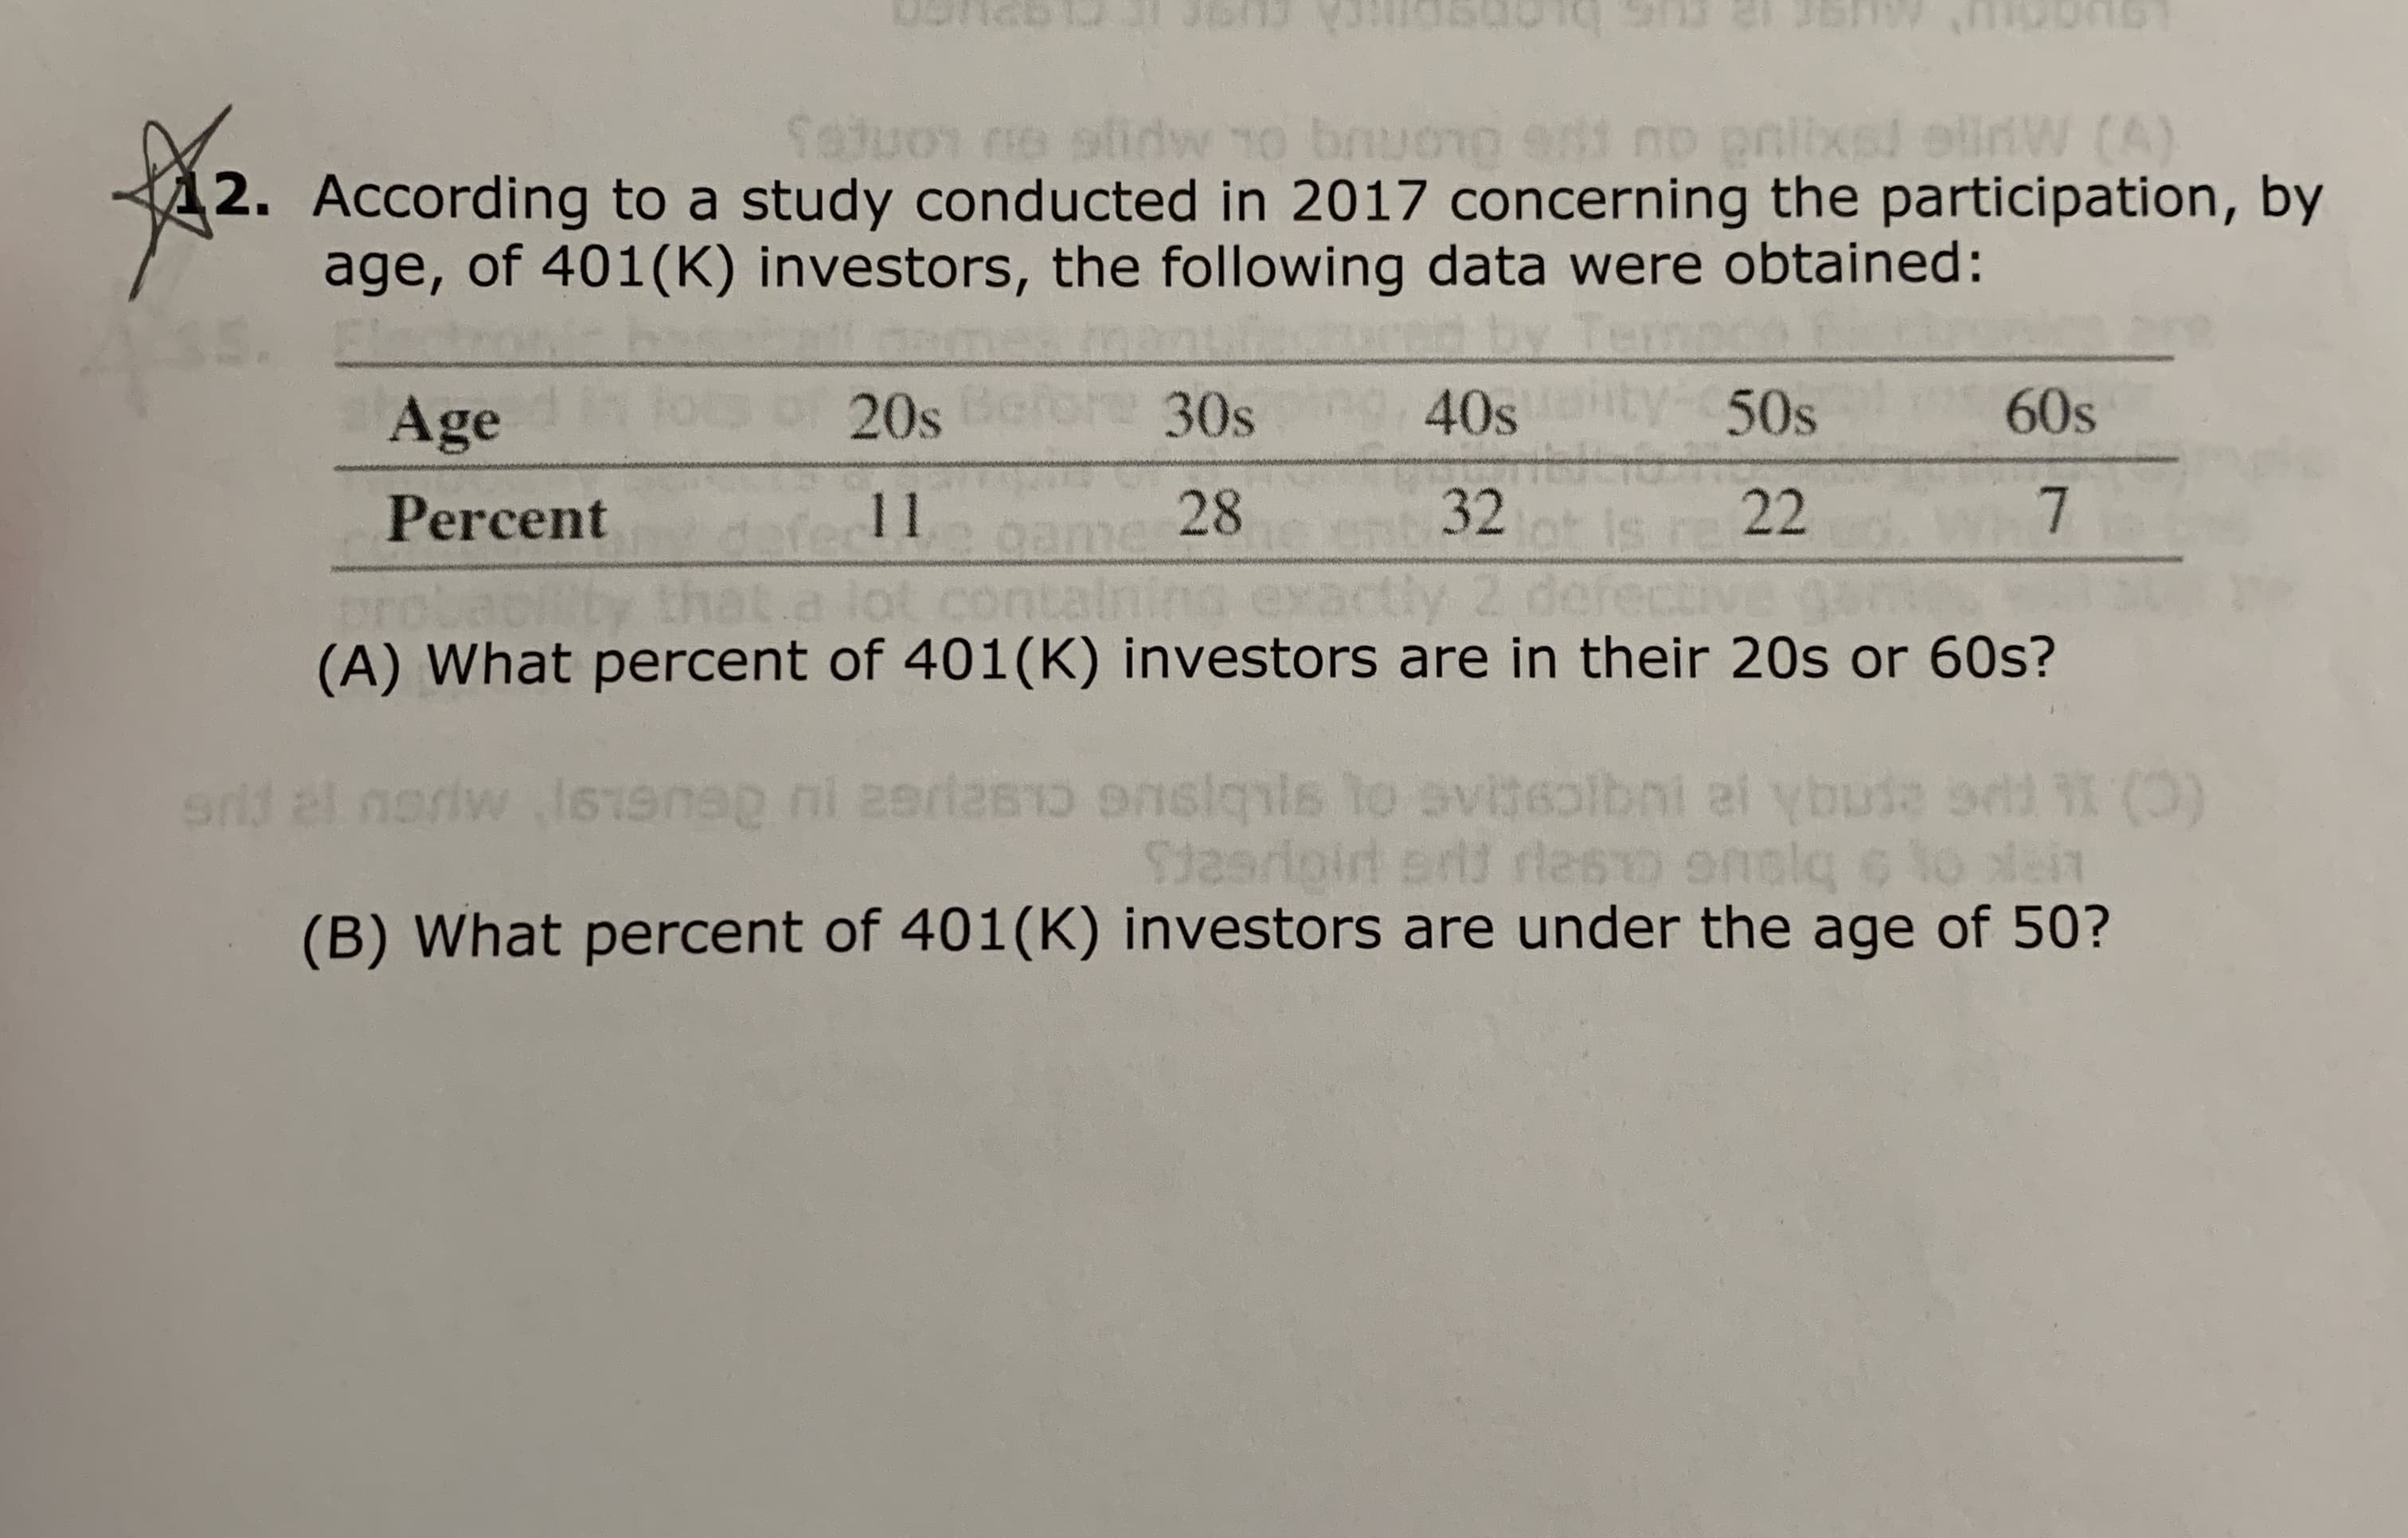
t:13 Shy bruonp LOncey C W (A) Sai ni no 2. According to a study conducted in 2017 concerning the participation, by age, of 401(K) investors, the following data were obtained: 5. 40sty 50s 60s 20s Be 30s Age 7 28 32 22 11 Percent ly ot con (A) What percent of 401(K) investors are in their 20s or 60s? r al noriw ls1en i erte10 lsto svitsolbni al Ybuie d( Stasridiold ertd desto on lq to cten (B) What percent of 401(K) investors are under the age of 50? ni ai ybute sdt( siqis lo 6 STO


Q: 4. The table below gives the purchasing power of the dollar as measured by consumer prices according…
A: Given data, Year Consumer prices 1983 1.003 1984 0.961 1985 0.928 1986 0.913 1987 0.88…
Q: 4. The table below gives the purchasing power of the dollar as measured by consumer prices according…
A: The scatter diagram is used to describe the linear relationship between two variables. The…
Q: 2. The following table shows the estimated populations and annual growth rates for four countries in…
A:
Q: 10. A survey conducted over the last 25 years indicated that in 10 years the winter was mild, in 8…
A:
Q: You are given the following information concerning three portfolios, the market portfolio, and the…
A: Hiii
Q: In what sense is the mean teh center of distributon? a.M is the center because half the sample…
A: The mean is is the centre of the distribution because mean is based on all the observation. The sum…
Q: The following table contains the predicted monthly sales and actual monthly sales for a company over…
A:
Q: This exercise is based on the following data on four bodybuilding supplements. (Figures shown…
A: Given- Your personal trainer suggests that you supplement with at least 7 grams of creatine, 30.5…
Q: Refer to Exercise 12 in Section 3.2. Assume that τ0 = 50 ± 1 MPa, w = 1.2 ± 0.1 mm, and k= 0.29 ±…
A:
Q: Sleep Deprivation M SD 5-hours 11.167 1.835 10-hours 10.500 2.074 15-hours 7.333 5.046…
A: Solution: From the given information, the p-value is 0.009.
Q: The management of a manufacturer of electric motors, submitted the accompanying data in its annual…
A: Solution
Q: The table below shows the number of chickens slaughtered during each month of 2021, as wel as the…
A: Given the data as Date t Birds Slaughtered Yt Slaughter ForecastY^t, WMA 1/28/2021 6045000…
Q: The payoff table depicting revenues and is shown in the following table. payoffs (PV in millions)…
A: Since you have posted a question with multiple subparts, we will solve first three subparts for you.…
Q: This exercise is based on the following data on three bodybuilding supplements. (Figures shown…
A:
Q: The population proportion of Americans with diabetes is 11 percent (π = 0.11). In repeated random…
A: The population proportion of Americans with diabetes is 11 percent (π = 0.11). In repeated random…
Q: This exercise is based on the following data on four bodybuilding supplements. (Figures shown…
A: Step:-1 Note:- In given problem you are thinking of combining Xtend and Gainz to provide you the…
Q: f three supermarkets are selling a chocolate bar for 1.15 JD, five are selling it for 1.25 JD, and…
A: Given data, 3 supermarkets are selling chocolate for 1.15 5 supermarkets are selling chocolate for…
Q: The table below shows the population of a fictional California Gold Rush Town named Lehi in the…
A: Given - P is the population of Lehi t is the years after 1880 We have to…
Q: Explain Which of the following would have the largest influence? (h is the leverage, R is the…
A: A data point is influential if it influences any part of a regression analysis, such as the…
Q: A renovation of the gift shop at Orlando Amway Center has six activities (in hours). In the…
A: Calculate the expected duration using the following formula: Expected time = a+4m+b6 Here, a is the…
Q: gives the population and earnings of two town A and B. Represent the data graphically so as to bring…
A:
Q: The following data lists different investment amounts (X) and the amount of interest (Y): X5 Y 2.5…
A: Here is the solution:
Q: The following table gives the quantity demanded of ice cream (Qic) in kgs per year in Sardinia…
A: The following table gives the quantity demanded of ice cream (Qic) in kgs per year in Sardinia…
Q: This exercise is based on the following data on four bodybuilding supplements. (Figures shown…
A:
Q: 14. Your investment executive claims that the average yearly rate of return on the stocks she…
A: We have given that Claim : The average yearly rate of return on the stocks she recommends is at…
Q: Do you have to be rich to invest in bonds and real estate? No, mutual fund shares are available to…
A: Hey, since there are multiple subparts posted, we will answer first three subparts. If you want any…
Q: 5. Calculate Karl Pearson's co-efficient of correlation. x: 1 2 3 4 6. 7 y: 3 8 19 11 13
A:
Q: 1. The average normal daily temperature ( in degree Celsius) and the corresponding average monthly…
A: Given data is Temperature(x) 30 27 28 32 27 23 18 Precipitation(y) 3.4 1.8 3.5 3.6 3.7 1.5 0.2
Q: (a) At an accident black spot junction, road accidents generally occur at a rate of 5 per month, on…
A:
Q: X, and WWP. Each week, APS loses 10% of its customers to GX and 20% to WWP, GX loses 15% of its…
A: *answer:
Q: (a) We wish to test the null hypothesis that the Las Vegas predictions are unbiased. This will…
A:
Q: Suppose that the index model for stocks A and B is estimated from excess returns with the following…
A: Please find the explanation below. Thank you
Q: From a sample of 141 items, 21 are defective. The point estimate of the population proportion…
A:
Q: Q3. A study was conducted to compare the relative effectiveness of two cough medicines ( A and B) in…
A: Since you have posted a question with multiple sub-parts, we will solve first three sub-parts for…
Q: 3a. The following table contains data from the Chicago Public School system (CPS) on 6th graders who…
A:
Q: Use the scatterplot of Vehicle Registrations below to answer the questions Vehicle Registrations in…
A: The scatter plot is given as:
Q: The boxplots show data for state and local community expenditures on police and fire protection.…
A: Given that,
Q: Mr. William Profit is studying companies going public for the first time. He is particularly…
A: Required Regression analysis can be done using excel as follows: 1. Enter the data into the excel…
Q: The following data lists different investment amounts (X) and the amount of interest (Y): X5 Y 10 20…
A: Solution-: Given data: Let, X=Investment amount and Y=Amount of interest X Y 5 2.5 10 5 20…
Q: 1. The average normal daily temperature ( in degree Celsius) and the corresponding average monthly…
A:
Q: Exercise 13-50 (LO13-6) Mr. William Profit is studying companies going public for the first time. He…
A: (a) Step-by-step procedure to find the regression equation using Excel: In Excel sheet, enter X in…
Q: The following table gives the quantity demanded of ice cream (Qic) in kgs per year in Sardinia…
A: The given table gives the quantity demanded of ice cream (Qic) in kgs per year in Sardinia (Italy),…
Q: A study of the effects of three drugs on reaction time in milliseconds of human subjects after…
A: H0 : The three drugs do not differ in their effects. Ha : The three drugs differ in their effects.…
Q: George Kyparisis owns a company that manufactures sailboats. Actual demand for George's sailboats…
A: we solve this problem using excel
Q: The table shows data from a science fair experiment that studied the average growth rate of 20…
A: Total samples are 40 combining samples of 70 degrees Fahrenheit and 80 degrees Fahrenheit.
Q: To investigate the dependence of energy expenditure on body build, researchers used underwater…
A: a. In this case Fat-Free Mass (x) is the independent variable and Energy Expenditure (y) is the…
Q: Below are percentages for annual sales growth and net sales attributed to loyalty card usage at 74…
A: Given data store growth% loyalty % 1 -7.8 0.7 2 -6.9 2.5 3 -5.1 1.6 4 -4.7 1.4 5 -3.8…
Q: The average normal daily temperature ( in degree Celsius) and the corresponding average monthly…
A:
Q: Model the following data with a power formula. x 1 2 3 4 5 y 1 1/8 1/27 1/64 1/25
A: Let's assume the model y = axb when x = 1 then y = 1 1 = a * 1b 1 = a So, the value of a = 1
Q: The following table gives the quantity demanded of ice cream (Qic) in kgs per year in Sardinia…
A: Note:- Since you have posted a question with multiple sub-parts, we will solve first three…


Trending now
This is a popular solution!

Step by step
Solved in 2 steps with 1 images

- The National Highway Association is studying the relationship between the number of bidders on a highway project and the winning (lowest) bid for the project. Of particular interest is whether the number of bidders increases or decreases the amount of the winning bid. Bidders Price 9.0 5.1 9.0 8.0 3.0 9.7 10.0 7.8 5.0 7.7 10.0 5.5 7.0 8.3 11.0 5.5 6.0 10.3 6.0 8.0 4.0 8.8 7.0 9.4 7.0 8.6 7.0 8.1 6.0 7.8 Given: Correlation of Coefficient: 0.7064 (This is correct) Coefficient of determination: 49.90% (This is correct) ŷ = 11.2360 + (-0.4667)x (This is correct) Create a scatter plot of the data Complete a regression analysis of the relationship. Slope = ______ Estimate the winning bid if there were seven bidders. Winning bid cost ______ millions. Compute the 95% prediction interval for a winning bid if there are seven bidders. [ _____________, ______________]The National Highway Association is studying the relationship between the number of bidders on a highway project and the winning (lowest) bid for the project. Of particular interest is whether the number of bidders increases or decreases the amount of the winning bid. Bidders Price 9.0 5.1 9.0 8.0 3.0 9.7 10.0 7.8 5.0 7.7 10.0 5.5 7.0 8.3 11.0 5.5 6.0 10.3 6.0 8.0 4.0 8.8 7.0 9.4 7.0 8.6 7.0 8.1 6.0 7.8 GIVEN: correlation coefficient: - 0.7064 Slope: -0.4667 Coefficient of determination: 49.90% regression equation: ŷ= 11.2360 + (-4467)x FIND: Estimate the winning bid if there were seven bidders. Winning bid cost _________ millions. Explain. Compute the 95% prediction interval for a winning bid if there are seven bidders. [ _______________ , _______________ ] (Explain).In a public opinion survey, 60 out of a sample of 100 high-income voters and 40 out of a sample of 75 low-income voters supported a decrease in value-added tax, VAT. Conclude at the 5% level of significance that the population of voters favouring a VAT decrease differs between high- and low-income voters. (Where p1 is the proportion of all high-income voters who supported a decrease in VAT; p2 is the same for the low-income voters). The rejection region to test the above hypothesis at the 5% significance level (rounded off to two decimals) is: A. T < -1.96 B. T < -1.64 or Z > 1.64 C. Z < -1.96 or Z > 1.96 D. Z < -1.64 E. None of the preceding
- In a public opinion survey, 60 out of a sample of 100 high-income voters and 40 out of a sample of 75 low-income voters supported a decrease in value-added tax, VAT. Conclude at the 5% level of significance that the population of voters favouring a VAT decrease differs between high- and low-income voters. (Where p1 is the proportion of all high-income voters who supported a decrease in VAT; p2 is the same for the low-income voters). The rejection region to test the above hypothesis at the 5% significance level is: A. T < - 1.96 B. T < - 1.96 or Z > 1.64 C. Z< - 1.96 or Z > 1.96 D. Z < -1.64In a public opinion survey, 60 out of a sample of 100 high-income voters and 40 out of a sample of 75 low-income voters supported a decrease in value-added tax, VAT. Conclude at the 5% level of significance that the population of voters favouring a VAT decrease differs between high- and low-income voters. (Where p1 is the proportion of all high-income voters who supported a decrease in VAT; p2 is the same for the low-income voters). The hypotheses are: A. H0: p1 - p2 = 0 vs H1: P1 - p2 ≠ 0 B. H0: p1 - p2 > 0 vs H1- P1 - p2 < 0 C. H0: p1 - p2 > 0 vs H1: P1 - p2 ≠ 0 D. H0: p1 - p2 ≠ 0 vs H1: P1 - p2 = 0 E. None of the precedingThere is some evidence that, in the years 1981— 85, a simple name change resulted in a short-term increase in the price of certain business firms' stocks (relative to the prices of similar stocks). (See D. Horsky and P. Swyngedouw, "Does it pay to change your company's name? A stock market perspective," Marketing Science v.6 pp. 320— 35, 1987.) Suppose that, to test the profitability of name changes in the more recent market (the past five years), we analyze the stock prices of a large sample of corporations shortly after they changed names, and we find that the mean relative increase in stock price was about 0.76%, with a standard deviation of 0.12%. Suppose that this mean and standard deviation apply to the population of all companies that changed names during the past five years. Complete the following statements about the distribution of relative increases in stock price for all companies that changed names during the past five years. (a)According to Chebyshev's theorem,…
- Acoording to scientists, the cockroach has had 300 million years to develop a resistance to destruction. In a study conducted by tesearchers, 4,000 reaches (the expected number in a rouch-infested house) were released in the tost kibchen. One week later, the kitchen was fumigated and 14,465 dead roaches were counted, a gain of 10,465 roaches for the 1 -week period. Assume that none of the original roaches died during the 1 -week period and that the standard deviation ofx, the number of roaches produced per roach in a 1 -weok period, is 1.3 . Use the number of roaches produced by the sample of 4,000 rosches to find a pos confidence interval for the mean number of roaches produced per wook for each rosch in a typical toach-infosted house. Find a99%confidence interval for the mean number of roaches prodused per week for each roach in a typical roach infested housen (Round to three decimal places as needed)There is some evidence that, in the years−198185, a simple name change resulted in a short-term increase in the price of certain business firms' stocks (relative to the prices of similar stocks). (See D. Horsky and P. Swyngedouw, "Does it pay to change your company's name? A stock market perspective," Marketing Science v. 6, pp.−32035,1987.) Suppose that, to test the profitability of name changes in the more recent market (the past five years), we analyze the stock prices of a large sample of corporations shortly after they changed names, and we find that the mean relative increase in stock price was about 0.86 %, with a standard deviation of 0.10%. Suppose that this mean and standard deviation apply to the population of all companies that changed names during the past five years. Complete the following statements about the distribution of relative increases in stock price for all companies that changed names during the past five years. According to Chebyshev's theorem, at least 84%…There is some evidence that, in the years −198185 , a simple name change resulted in a short-term increase in the price of certain business firms' stocks (relative to the prices of similar stocks). (See D. Horsky and P. Swyngedouw, "Does it pay to change your company's name? A stock market perspective," Marketing Science v. 6 , pp. −32035,1987 .) Suppose that, to test the profitability of name changes in the more recent market (the past five years), we analyze the stock prices of a large sample of corporations shortly after they changed names, and we find that the mean relative increase in stock price was about 0.89 %, with a standard deviation of 0.16 %. Suppose that this mean and standard deviation apply to the population of all companies that changed names during the past five years. Complete the following statements about the distribution of relative increases in stock price for all companies that changed names during the past five years. (a)…
- 1. Find the percent of increase or decrease for each of the following stocks: A. Visto Networks, Inc. _________________Purchase Price = 20.75 Current Price = 47.63 B. Time Warner _________________Purchase Price = 7.50 Current Price = 10.18 C. Microsoft _________________Purchase Price = 22 Current Price = 26.22 D. Amazon _________________Purchase Price = 11.50 Current Price = 8.85 E. Dell Computers _________________Purchase Price = 71.50 Current Price = 58.45 F. Ford _________________Purchase Price = 31.50 Current Price = 28.38 G. Foot Locker _________________Purchase Price = 61.50 Current Price = 78.38 2. Based on this sample, was it a good day for stocks? (Yes, if the majority of the stocks went up.)Suppose in a tournament with only three players left, first place receives $6,000, second place receives $3,000, and third place receives $500. You have a 32% chance of winning first place, 30% chance of winning second place, and 38% chance of winning third place. a. What would be your expected winnings in this tournament? b. The tournament organizer gives you the option to continue playing or stop and split the total prize money, proportional to your current standings. If you currently have 700 of the 1800 chips currently in play, how much would you win if you stopped playing and split the winnings? c. Based on parts a and b, should you continue playing or stop and split the money? Why?There is some evidence that, in the years 1981-85, a simple name change resulted in a short-term increase in the price of certain business firms' stocks (relative to the prices of similar stocks). (See D. Horsky and P. Swyngedouw, "Does it pay to change your company's name? A stock market perspective," Marketing Science v.6, pp. 320-35,1987.) Suppose that, to test the profitability of name changes in the more recent market (the past five years), we analyze the stock prices of a large sample of corporations shortly after they changed names, and we find that the mean relative increase in stock price was about 0.87 %, with a standard deviation of 16 %. Suppose that this mean and standard deviation apply to the population of all companies that changed names during the past five years. Complete the following statements about the distribution of relative increases in stock price for all companies that changed names during the past five years. (a) According to Chebyshev's theorem, at least…
