Tab Help O ? 12% D Mon 9:33 PM Chrome File Edit View History Bookmarks People Window ··· H Take Test: Week # 12 assignm S A Not Secure bb.wpunj.edu webapps/assessment/take/launch.jsp?course assessment id= 92221 1&course id= 129468_1&content id=2567819.1&step=null ¥ Question Completion Status: QUESTION 2 This example is taken from A. Field "Discovering Statistics" The chi-square statistic is used in a variety of situations, but one of them is to test whether two categorical variables forming a contingency table are associated. A contingency table displays the cross-classification of two or more categorical variables. The levels of each variable are arranged in a grid, and the number of observations falling into each category is noted in the cells of the table. For example, if we took the categorical variables of learning statistics (with two categories: being forced to learn it or not), and depression (with two categories: diagnosis or not), we could construct a table as below. This instantly tells us that 150 of 155 people who were made to learn statistics ended up with a diagnosis of depression, compared to only 48 of 471 people who did not learn statistics. A chi-square test would enable us to see whether this apparent relationship is statistically significant. Depression Diagnosis No Diagnosis Total Learn Statistics No Statistics Total 150 48 198 423 428 155 471 1252 Calculate the Chi-square following instructions either in Excel, or Google sheets.
Tab Help O ? 12% D Mon 9:33 PM Chrome File Edit View History Bookmarks People Window ··· H Take Test: Week # 12 assignm S A Not Secure bb.wpunj.edu webapps/assessment/take/launch.jsp?course assessment id= 92221 1&course id= 129468_1&content id=2567819.1&step=null ¥ Question Completion Status: QUESTION 2 This example is taken from A. Field "Discovering Statistics" The chi-square statistic is used in a variety of situations, but one of them is to test whether two categorical variables forming a contingency table are associated. A contingency table displays the cross-classification of two or more categorical variables. The levels of each variable are arranged in a grid, and the number of observations falling into each category is noted in the cells of the table. For example, if we took the categorical variables of learning statistics (with two categories: being forced to learn it or not), and depression (with two categories: diagnosis or not), we could construct a table as below. This instantly tells us that 150 of 155 people who were made to learn statistics ended up with a diagnosis of depression, compared to only 48 of 471 people who did not learn statistics. A chi-square test would enable us to see whether this apparent relationship is statistically significant. Depression Diagnosis No Diagnosis Total Learn Statistics No Statistics Total 150 48 198 423 428 155 471 1252 Calculate the Chi-square following instructions either in Excel, or Google sheets.

MATLAB: An Introduction with Applications
6th Edition
ISBN:9781119256830
Author:Amos Gilat
Publisher:Amos Gilat
Chapter1: Starting With Matlab
Section: Chapter Questions
Problem 1P

Related questions
Question
Calculate the Chi-square following instructions either in Excel or Google sheets
Transcribed Image Text:File
Edit View History Bookmarks
People Tab
Window Help
12% |
Mon 9:33 PM
Chrome
Rh Take Test: Week # 12 assignm X
S
e → C A Not Secure bb.wpunj.edu webapps/assessment/take/launch.jsp?course_assessment_id%3D_92221 1&course_id=_129468_1&content id%3 2567819 1&step%3null
¥ Question Completion Status:
QUESTION 2
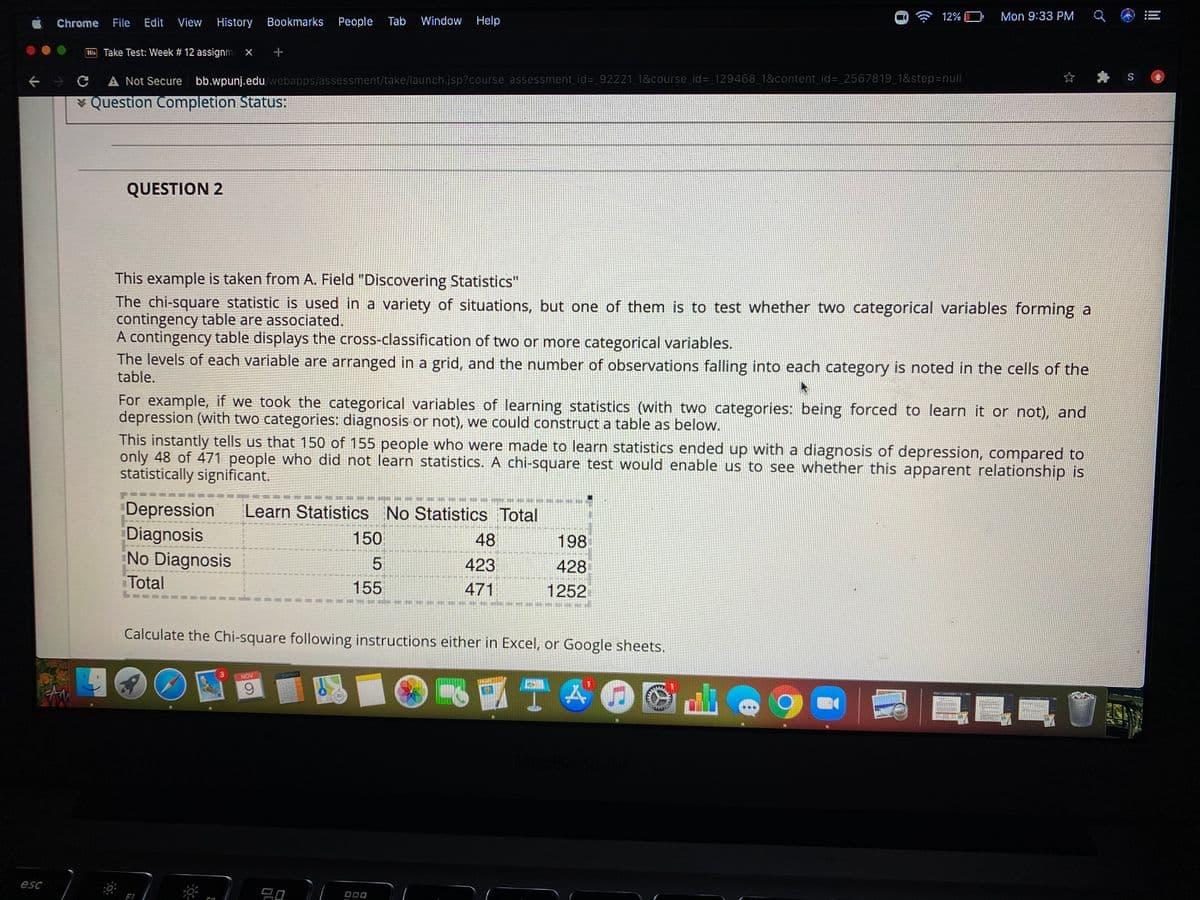
This example is taken from A. Field "Discovering Statistics"
The chi-square statistic is used in a variety of situations, but one of them is to test whether two categorical variables forming a
contingency table are associated.
A contingency table displays the cross-classification of two or more categorical variables.
The levels of each variable are arranged in a grid, and the number of observations falling into each category is noted in the cells of the
table.
For example, if we took the categorical variables of learning statistics (with two categories: being forced to learn it or not), and
depression (with two categories: diagnosis or not), we could construct a table as below.
This instantly tells us that 150 of 155 people who were made to learn statistics ended up with a diagnosis of depression, compared to
only 48 of 471 people who did not learn statistics. A chi-square test would enable us to see whether this apparent relationship is
statistically significant.
擁動
Depression
Diagnosis
No Diagnosis
Learn Statistics No Statistics Total
150
48
198
5
423
428
Total
155
471
1252
Calculate the Chi-square following instructions either in Excel, or Google sheets.
NOV
2547
esc
Expert Solution
This question has been solved!
Explore an expertly crafted, step-by-step solution for a thorough understanding of key concepts.

This is a popular solution!

Trending now
This is a popular solution!

Step by step
Solved in 2 steps with 5 images

Knowledge Booster


Learn more about
Need a deep-dive on the concept behind this application? Look no further. Learn more about this topic, statistics and related others by exploring similar questions and additional content below.Recommended textbooks for you
MATLAB: An Introduction with Applications
Statistics
ISBN:
9781119256830
Author:
Amos Gilat
Publisher:
John Wiley & Sons Inc

Probability and Statistics for Engineering and th…
Statistics
ISBN:
9781305251809
Author:
Jay L. Devore
Publisher:
Cengage Learning

Statistics for The Behavioral Sciences (MindTap C…
Statistics
ISBN:
9781305504912
Author:
Frederick J Gravetter, Larry B. Wallnau
Publisher:
Cengage Learning
MATLAB: An Introduction with Applications
Statistics
ISBN:
9781119256830
Author:
Amos Gilat
Publisher:
John Wiley & Sons Inc
Probability and Statistics for Engineering and th…
Statistics
ISBN:
9781305251809
Author:
Jay L. Devore
Publisher:
Cengage Learning
Statistics for The Behavioral Sciences (MindTap C…
Statistics
ISBN:
9781305504912
Author:
Frederick J Gravetter, Larry B. Wallnau
Publisher:
Cengage Learning

Elementary Statistics: Picturing the World (7th E…
Statistics
ISBN:
9780134683416
Author:
Ron Larson, Betsy Farber
Publisher:
PEARSON

The Basic Practice of Statistics
Statistics
ISBN:
9781319042578
Author:
David S. Moore, William I. Notz, Michael A. Fligner
Publisher:
W. H. Freeman

Introduction to the Practice of Statistics
Statistics
ISBN:
9781319013387
Author:
David S. Moore, George P. McCabe, Bruce A. Craig
Publisher:
W. H. Freeman