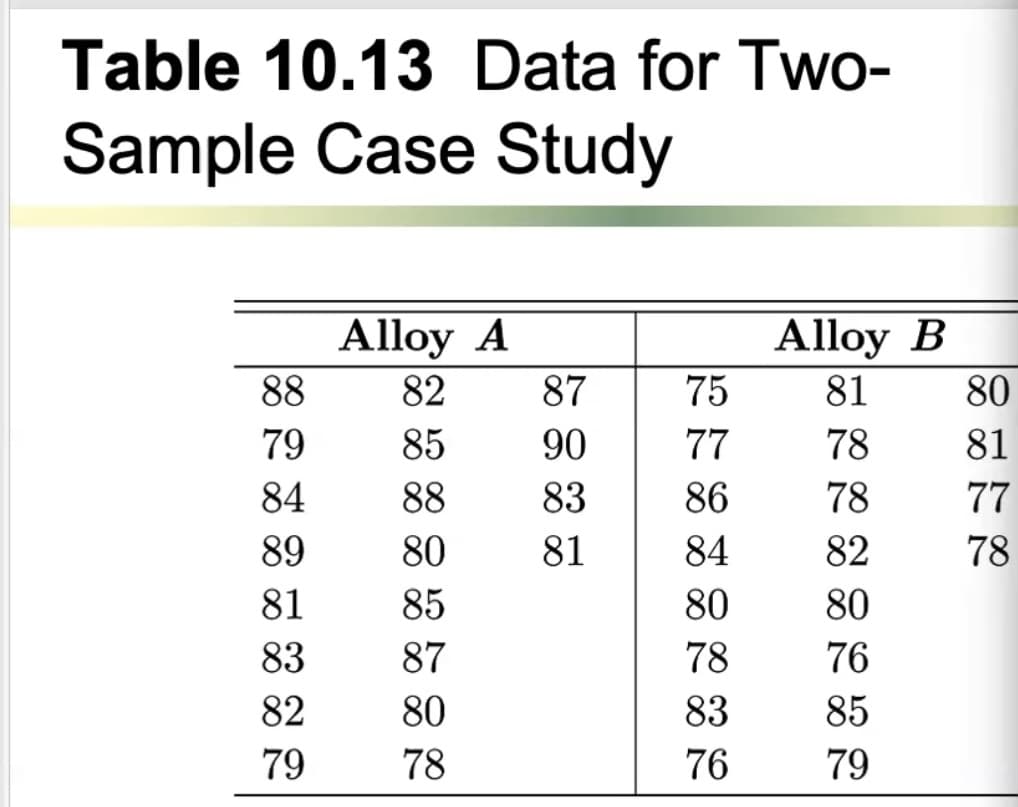
Table 10.13 Data for Two- Sample Case Study Alloy A Alloy B 88 82 87 75 81 80 79 85 90 77 78 81 84 88 83 86 78 77 89 80 81 84 82 78 81 85 80 80 83 87 78 76 82 80 83 85 79 78 76 79


Q: Suppose a government organization reported the accompanying data on the number of speed-related…
A: Given data: Speed-Related Fatalities Year New Years Day (x1) Memorial Day (x2) July 4th (x3)…
Q: The ages at death for a sample of 40 residents of postal code N1G are listed below. Find Pg5. 30 35…
A: The value of P85 is obtained below: From the given information, the ages at death for a sample of 40…
Q: Given the following data for an imaginary superhero universe: Female 53 63 Flying Telepathy Super…
A: The following data for imaginary superhero universe is: Flying Telepathy Super Strength Total…
Q: In a class of applied statistics course, 60 students are sit for the final exam and hence their…
A: Note, Since you have posted a question with multiple sub-parts, we will solve first three sub-parts…
Q: Consider the following 29 years worth of observed annual rainfall data (in inches) for a certain…
A: Quartile : The numbers that divide a list of numerical data into three quarters are known as…
Q: 1. We are interested in determining if absences from a class affect your overall class grade. The…
A: Hey, since there are multiple subparts posted, we will answer first three subparts. If you want any…
Q: The data below show the scores of the math exam and English exam of 20 students. Math Exam English…
A: 1. From the given information, The least squares regression line is Math score=3.45+0.933*English…
Q: A hypothetical data regarding consumption of fast food observed among the adults of a country is…
A: Given
Q: Grouped Data: 91 96 57 96 82 55 64 78 98 99 58 99 98 75 91 58 72 96 90 98 83 52 93 97 84 88 88 70 83…
A: Given data: 91 96 57 96 82 55 64 78 98 99 58 99 98 75 91 58 72 96 90 98 83 52 93 97 84 88 88 70 83…
Q: Suppose that the frequency table below contains data on female life expectancy at birth in 91…
A: We have given the frequency table below contains data on female life expectancy at birth in 91…
Q: A private research organization studying families in various countries reported the following data…
A: Given: n = 8 Formula Used: Interquartile Range
Q: The cumulative frequency table below shows the marks carned by 1400 students in Mathematics and…
A: The Median is the mid point of the value. The median is the second quartile. The mid point of the…
Q: The data show the population (in thousands) for a recent year of a sample of cities in South…
A: From the provided information, Sample size (n) = 25 Arranging the data values into ascending order…
Q: QUESTION 6 Obtain the five-number summary for the given data. The weekly salaries (in dollars) of…
A: Given problem is :
Q: The table below shows the examination results of 100 students as a percentage Exam Result (%)…
A: Since you have posted a question with multiple sub-parts, we will solve first 3 sub-parts for you.…
Q: Referring to the data, how many regions are above the 80th percentile of the nominal wage? Region…
A:
Q: A city government administers a survey to voters regarding proposed legislation for local school…
A: relative frequency of undecided number is highest in age : 18 - 21
Q: Find the point estimate of the population parameter μ for the following data. Scores in a…
A:
Q: The following data represents the age of 30 lottery winners. 23 32 32 33 34 36 37 40 43 44 48 49 52…
A:
Q: Consider the following 29 years worth of observed annual rainfall data (in inches) for a certain…
A: (a) Enter the data into the excel sheet as follows: Select the Annual rainfall column data and…
Q: Consider the following data that is relevant for this decision: Year Tea (L per person) Coffee (L…
A: 1) For tea : Arranging the data set in ascending order,42.12, 42.4, 47.61, 49.89, 50.61, 55.58,…
Q: Sixty students were given a history exam. Their scores are shown below, sorted from smallest to…
A: From the given date we want to find five number summery and histogram.
Q: The data refer to the glucose level of 60 children: 56 61 57 77 62 75 63 55 64 60 60 57 61 57 67 62…
A: Given data : 56 ,61, 57, 77, 62, 75, 63, 55, 64, 60, 60, 57, 61, 57, 67, 62, 69, 67, 68, 59, 65, 72,…
Q: 1. We are interested in determining if attendance affects a student's overall course grade. The…
A: The independent variable is Attendance %. The dependent variable is Overall Grade %. This is simple…
Q: Below are the ozone concentrations in random samples of areas of Metro Manila and the rest of…
A:
Q: The following table presents the annual person-hours of time lost due to traffic congestion for a…
A: Hi! Thanks for posting the question. Since there are more than three sub-part questions, we will…
Q: 14. FILE The food services division of Cedar River Amusement Park Inc. is studying the amount of…
A: Frequency distribution - Frequency distribution is a recorded series of values with counts of either…
Q: sample of rental cars showed the following annual mileage (in thousands of miles) 46.768 34.813…
A:
Q: Question 5 Find the median for the given sample data. In ten trips to Las Vegas, a person had the…
A:
Q: The lifetime of a type of battery, in hours, from a sample provided by a manufacturer is as follows…
A: For the given sample, The sample variance is, s^2=8.4889 and the sample standard deviation is…
Q: he following table gives the distribution of the total population and Age 0-10 10-20 20–30 30–40…
A: Given data, X Y X*Y X*X Y*Y 100 55 5500 10000 3025 60 40 2400 3600 1600 40 40 1600 1600…
Q: The following table displays blood pressure status by sex. Optimal Normal Hypertension Total Male 22…
A: The blood pressure status of male and female is, Optimal Normal Hypertension Total Male 22…
Q: A. The ages (in years) of 10 men and their systolic blood pressures (in millimeters of mercury) are…
A: The linear regression equation is of form y=β0+β1x Follow the steps below to get the Regression…
Q: Question 3 Obtain the five-number summary for the given data. The test scores of 15 students are…
A: It is an important part of statistics. It is widely used.
Q: GIVEN THE FOLLOWING DATA OF SCORES OF STUDENTS IN AN EXAM IN BASIC STATISTICS 29 32 41 24 42 34 23…
A: Given: The data given is shown below 29 32 41 24 42 34 23 32 40 29 30 42…
Q: uestion A group of 80 students took a statistics Exam in the following scores were recorded 68 84 75…
A: The data has to grouped for descriptive statistics calculation; The frequency distribution table for…
Q: The data below represent the age (in years) for 30 randomly selected students on campus this…
A: A data can be raw or grouped, with some pro and cons associated with both of them. The raw data has…
Q: Consider the following data that is relevant for this decision: Year Tea (L per person) Coffee (L…
A: The measure of central tendency are mean, median , mode
Q: Referring to Table 4-1, what proportion of accidents involved alcohol and a single vehicle? O 50/400…
A: Question 17: The probability formula is, Probability=Number of favourable outcomesTotal outcomes…
Q: GIVEN THE FOLLOWING DATA OF SCORES OF STUDENTS IN AN EXAM IN BASIC STATISTICS 29 32 41 24 42 34 23…
A: Calculate Percentiles-85 to 95 from the following…
Q: The following data give the numbers of orders received for a sample of 30 items at the Time-saver…
A: The median for the dataset is the data point which divides the data set in two equal halves. It lies…
Q: #10. The following data represent annual salaries, in thousands of dollars, for employees of a small…
A: “Since you have asked multiple questions, we will solve the first question for you. If you want any…
Q: A) In a class of applied statistics course, 60 students are sit for the final exam and hence their…
A: Since you have posted a question with multiple sub-parts, we will solve first three subparts for…
Q: 37 38 39 40 40 41 42 44 46 48 50 53 65 72 72 72 72 73 74 74 75 75 76 76 76 76 77 77 77 77 78 79 79…
A: 60 students were given a history exam. Their scores are shown below, sorted from smallest to…
Q: 1. Consider the scores of 30 students in an English class. 88 73 62 53 74 84 78 81 86 81 85 78 72 73…
A: Arrange the observations in an ascending order. Here, the number of observations are even.…
Q: For the following question, look at the table below that shows the frequency of ages in a sample:…
A: Given:
Q: The following table displays blood pressure status by sex. Optimal Normal Hypertension Total 73 55…
A: Total number of patients with hypertension = 120 Number of males = 55
Q: The following data give the numbers of orders received for a sample of 30 items at the Time-saver…
A: Giventhat The data are…
Q: ... 96 99 81 47 71 78 72 34 50 66 94 85 77 82 99 99 67 68 The grades of a sample of 9 students on a…
A:
Q: You are interested in investigating whether the type of computer a person primarily uses and the…
A: It is needed to test, whether the type of computer a person primarily uses and the type of car they…

Step by step
Solved in 3 steps with 3 images
