Table 11.6 Absorbance at 470 nm of Peroxlde/Peroxldase Solutions 0.0 min 0.5 min 1.0 min 1.5 min 2.0 2.5 min 3.0 3.5 min 4.0 min Tube 4.5 min 5.0 min 0.0j2 0.D10 0-010 0.0IO 0.010 0-010 0.010 0.010 0 010 0.010 0.010 0.008 0.008 0-008 0-008 0.008 0.008 0.008 0-008 0-008 Or008 0.008 0.01l6 0.011 0.01) 3. O.011 0.011 0.011 0.01n 0,011 00il 0.011 O.011 4. 0.064 0.059 0.058 0.058 0,059 0-0590059 0-059 O-059 0.059 0.059 1.9991.999 1.959 1.999 1999 1999 1999 1.999 1999 1999 1L999 0.132 0.203 0.288 0340 0.4DD 0.434 04500460014620454 0.488 l0.4480.688 0.950 1.170 1,330 1.500 1,l0001701 1,780 1.852 1910 0.378 0.778 1.130 1.4201.6o 1.850 1.999 1.9991.9991.9991999 0.825 1.5601.999 1.9991999 199,9991-9991.999 1.9991999 6. Write a null hypothesis and an alternate hypothesis for the impact of the inhibitor on enzyme activity. Summary: What are the following components in the experiment? a. Substrate b. Enzyme c. Inhibitor d. Indicator Look at the results for tubes 1-4. Explain the results that were obtained for these tubes.
Table 11.6 Absorbance at 470 nm of Peroxlde/Peroxldase Solutions 0.0 min 0.5 min 1.0 min 1.5 min 2.0 2.5 min 3.0 3.5 min 4.0 min Tube 4.5 min 5.0 min 0.0j2 0.D10 0-010 0.0IO 0.010 0-010 0.010 0.010 0 010 0.010 0.010 0.008 0.008 0-008 0-008 0.008 0.008 0.008 0-008 0-008 Or008 0.008 0.01l6 0.011 0.01) 3. O.011 0.011 0.011 0.01n 0,011 00il 0.011 O.011 4. 0.064 0.059 0.058 0.058 0,059 0-0590059 0-059 O-059 0.059 0.059 1.9991.999 1.959 1.999 1999 1999 1999 1.999 1999 1999 1L999 0.132 0.203 0.288 0340 0.4DD 0.434 04500460014620454 0.488 l0.4480.688 0.950 1.170 1,330 1.500 1,l0001701 1,780 1.852 1910 0.378 0.778 1.130 1.4201.6o 1.850 1.999 1.9991.9991.9991999 0.825 1.5601.999 1.9991999 199,9991-9991.999 1.9991999 6. Write a null hypothesis and an alternate hypothesis for the impact of the inhibitor on enzyme activity. Summary: What are the following components in the experiment? a. Substrate b. Enzyme c. Inhibitor d. Indicator Look at the results for tubes 1-4. Explain the results that were obtained for these tubes.

Biomedical Instrumentation Systems
1st Edition
ISBN:9781133478294
Author:Chatterjee
Publisher:Chatterjee
Chapter24: New Technologies And Advances In Medical Instrumentation
Section: Chapter Questions
Problem 3P

Related questions
Question
Need help with question number 4
Transcribed Image Text:b. What is a competitive inhibitor?
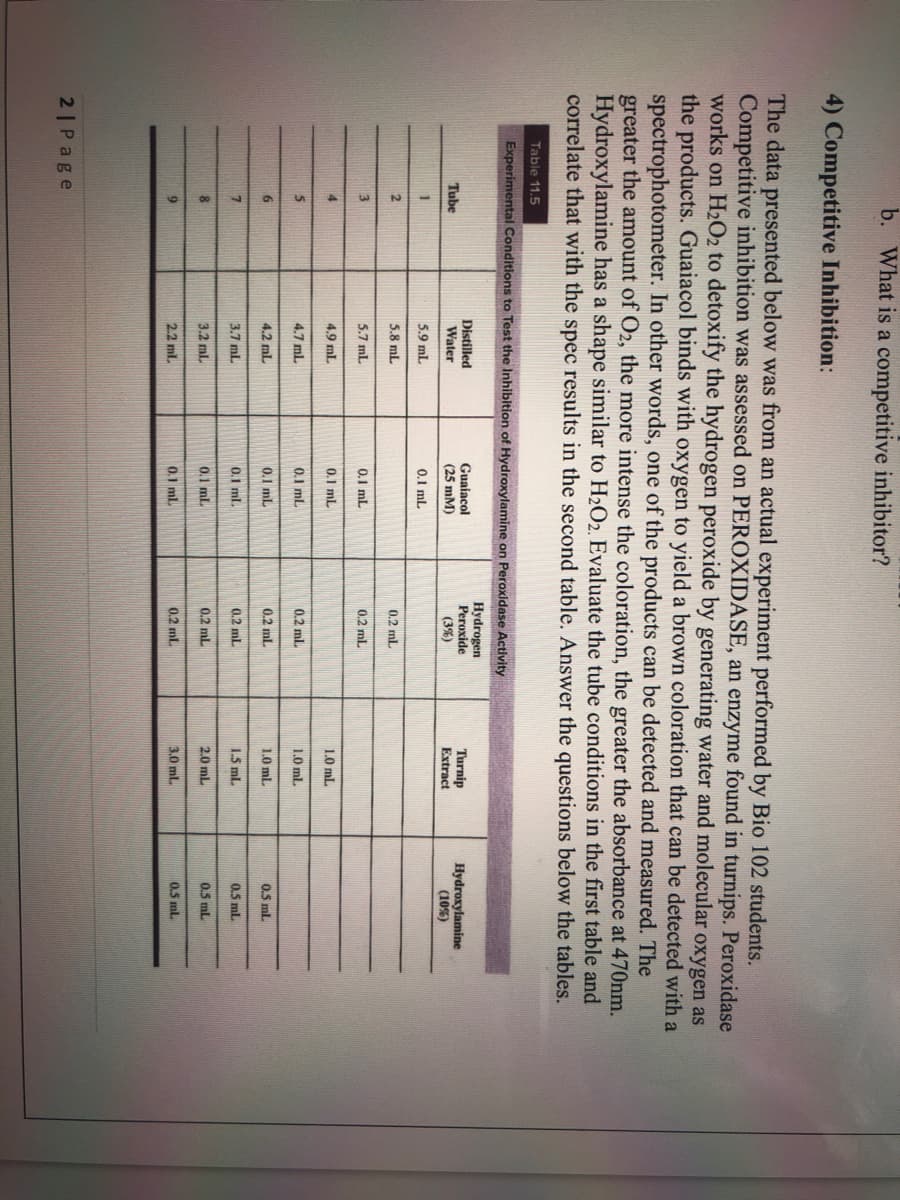
4) Competitive Inhibition:
The data presented below was from an actual experiment performed by Bio 102 students.
Competitive inhibition was assessed on PEROXIDASE, an enzyme found in turnips. Peroxidase
works on H2O2 to detoxify the hydrogen peroxide by generating water and molecular oxygen as
the products. Guaiacol binds with oxygen to yield a brown coloration that can be detected with a
spectrophotometer. In other words, one of the products can be detected and measured. The
greater the amount of O2, the more intense the coloration, the greater the absorbance at 470nm.
Hydroxylamine has a shape similar to H2O2. Evaluate the tube conditions in the first table and
correlate that with the spec results in the second table. Answer the questions below the tables.
Table 11.5
Experimental Conditions to Test the Inhibition of Hydroxylamine on Peroxidase Activity
Distilled
Water
Guaiacol
(25 mM)
Hydrogen
Peroxide
(3%)
Turnip
Extract
Hydroxylamine
(10%)
Tube
5.9 mL
0.1 mL
2.
5.8 mL
0.2 ml.
5.7 mL
0.1 mL
0.2 mL
4.
4.9 ml
0.1 mL
1.0 ml.
4.7 ml
0.1 ml
0.2 ml.
1.0 ml.
6.
4.2 mL
0.1 ml.
0.2 ml.
1.0 ml.
0.5 ml.
3.7 mL
0.1 ml
0.2 mL
1.5 ml.
0.5 ml.
8.
3.2 ml
0.1 ml.
0.2 ml
2.0 mL
0.5 ml
2.2 ml.
0.1 ml.
0.2 ml.
3.0 ml.
0.5 ml.
2|Page
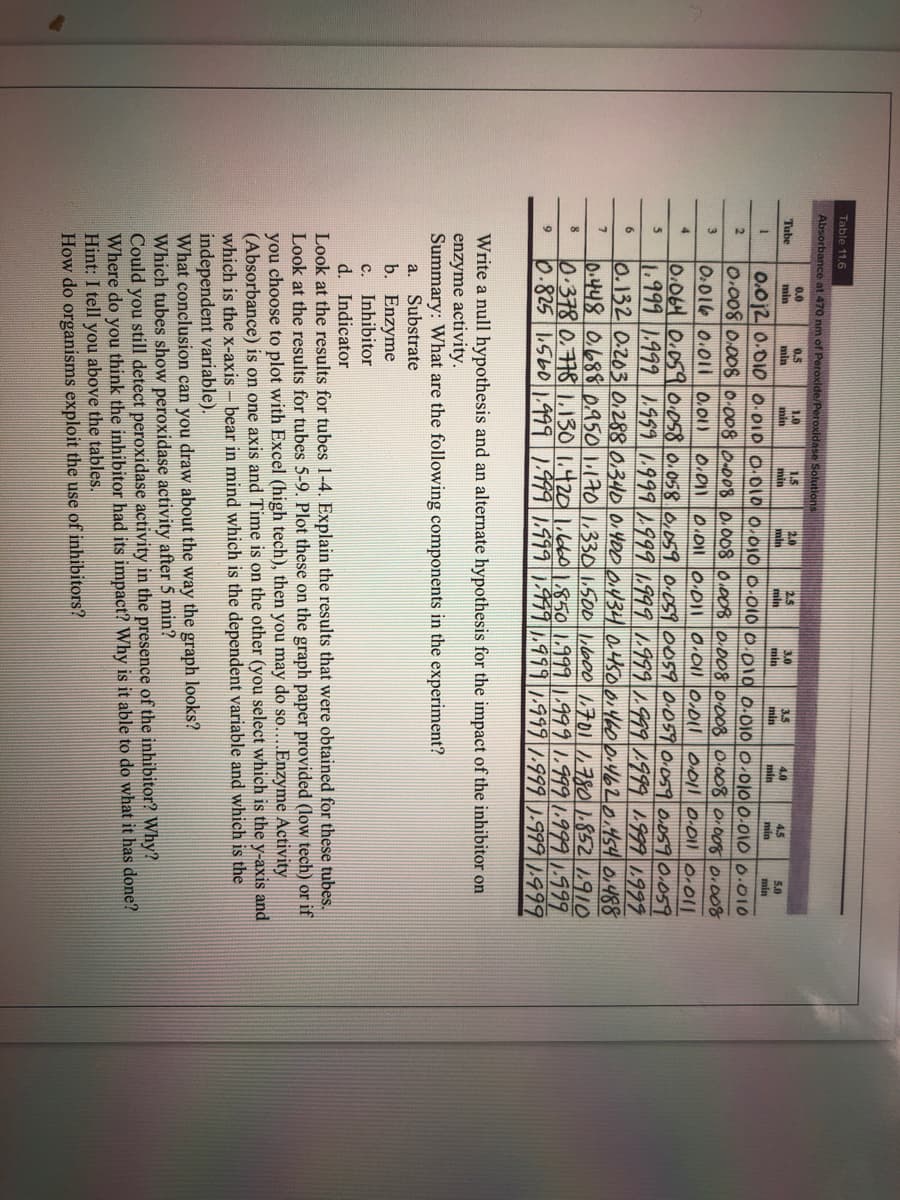
Transcribed Image Text:Table 11.6
Absorbance at 470 nm of Peroxide/Peroxldase Solutions
0.0
0.5
min
1.0
min
1.5
min
2.0
min
2.5
min
3.0
min
Tube
3.5
min
min
4.0
4.5
min
5.0
min
0.0j2 0.010 0-010 0.0IO 0.010 0-oi0 0.010 0.010 0.010 0.010 0.010
0.008 0.008 0-008 0-008 0.008 0.008 0.008 0-008 0-008 Or008 0.008
0.016 0.011 0.0)
min
3.
0.011 0.011 0.011 0.010 0,011 00il 0.011 Or011
l0.0640.0590:058 0.058 0,059 0.059 0059 0-059 0.059 O.059 0.059
1.999 1.999 1.959 1.99919991999 1.999 1999 1999 1.999 1.999
0.132 0.203 0,288 0340 0140D 0.434 0450o1460014620454 0,.488
l0.4480.6880.950 1.170 1,330 1.500 lil000 1,701 1,7801.852 1910
0.378 0.778 1.130 1.420 1.6601.8501.9991.9991.9991.9991.999
0.825 1.5601.999 1.999 1.999 1991999 1.9991.999 ).999 1.999
4.
6
8
Write a null hypothesis and an alternate hypothesis for the impact of the inhibitor on
enzyme activity.
Summary: What are the following components in the experiment?
a. Substrate
b. Enzyme
c. Inhibitor
d. Indicator
Look at the results for tubes 1-4. Explain the results that were obtained for these tubes.
Look at the results for tubes 5-9. Plot these on the graph paper provided (low tech) or if
you choose to plot with Excel (high tech), then you may do so....Enzyme Activity
(Absorbance) is on one axis and Time is on the other (you select which is the y-axis and
which is the x-axis – bear in mind which is the dependent variable and which is the
independent variable).
What conclusion can you draw about the way the graph looks?
Which tubes show peroxidase activity after 5 min?
Could you still detect peroxidase activity in the presence of the inhibitor? Why?
Where do you think the inhibitor had its impact? Why is it able to do what it has done?
Hint: I tell you above the tables.
How do organisms exploit the use of inhibitors?
Expert Solution
This question has been solved!
Explore an expertly crafted, step-by-step solution for a thorough understanding of key concepts.

This is a popular solution!

Trending now
This is a popular solution!

Step by step
Solved in 2 steps

Knowledge Booster


Learn more about
Need a deep-dive on the concept behind this application? Look no further. Learn more about this topic, biochemistry and related others by exploring similar questions and additional content below.Recommended textbooks for you
Understanding Nutrition (MindTap Course List)
Health & Nutrition
ISBN:
9781337392693
Author:
Eleanor Noss Whitney, Sharon Rady Rolfes
Publisher:
Cengage Learning
Understanding Nutrition (MindTap Course List)
Health & Nutrition
ISBN:
9781337392693
Author:
Eleanor Noss Whitney, Sharon Rady Rolfes
Publisher:
Cengage Learning