The one-sample t statistic for testing the hypotheses below from a sample of n = 19 observations has the value t = 1.6. Ho: μ = 0 Hg: μ > 0 (a) What are the degrees of freedom for this statistic? df = (b) Give the two critical values t* from Table C that bracket t. (Enter your answers to three decimal places.)
The one-sample t statistic for testing the hypotheses below from a sample of n = 19 observations has the value t = 1.6. Ho: μ = 0 Hg: μ > 0 (a) What are the degrees of freedom for this statistic? df = (b) Give the two critical values t* from Table C that bracket t. (Enter your answers to three decimal places.)

Linear Algebra: A Modern Introduction
4th Edition
ISBN:9781285463247
Author:David Poole
Publisher:David Poole
Chapter4: Eigenvalues And Eigenvectors
Section4.6: Applications And The Perron-frobenius Theorem
Problem 22EQ

Related questions
Question
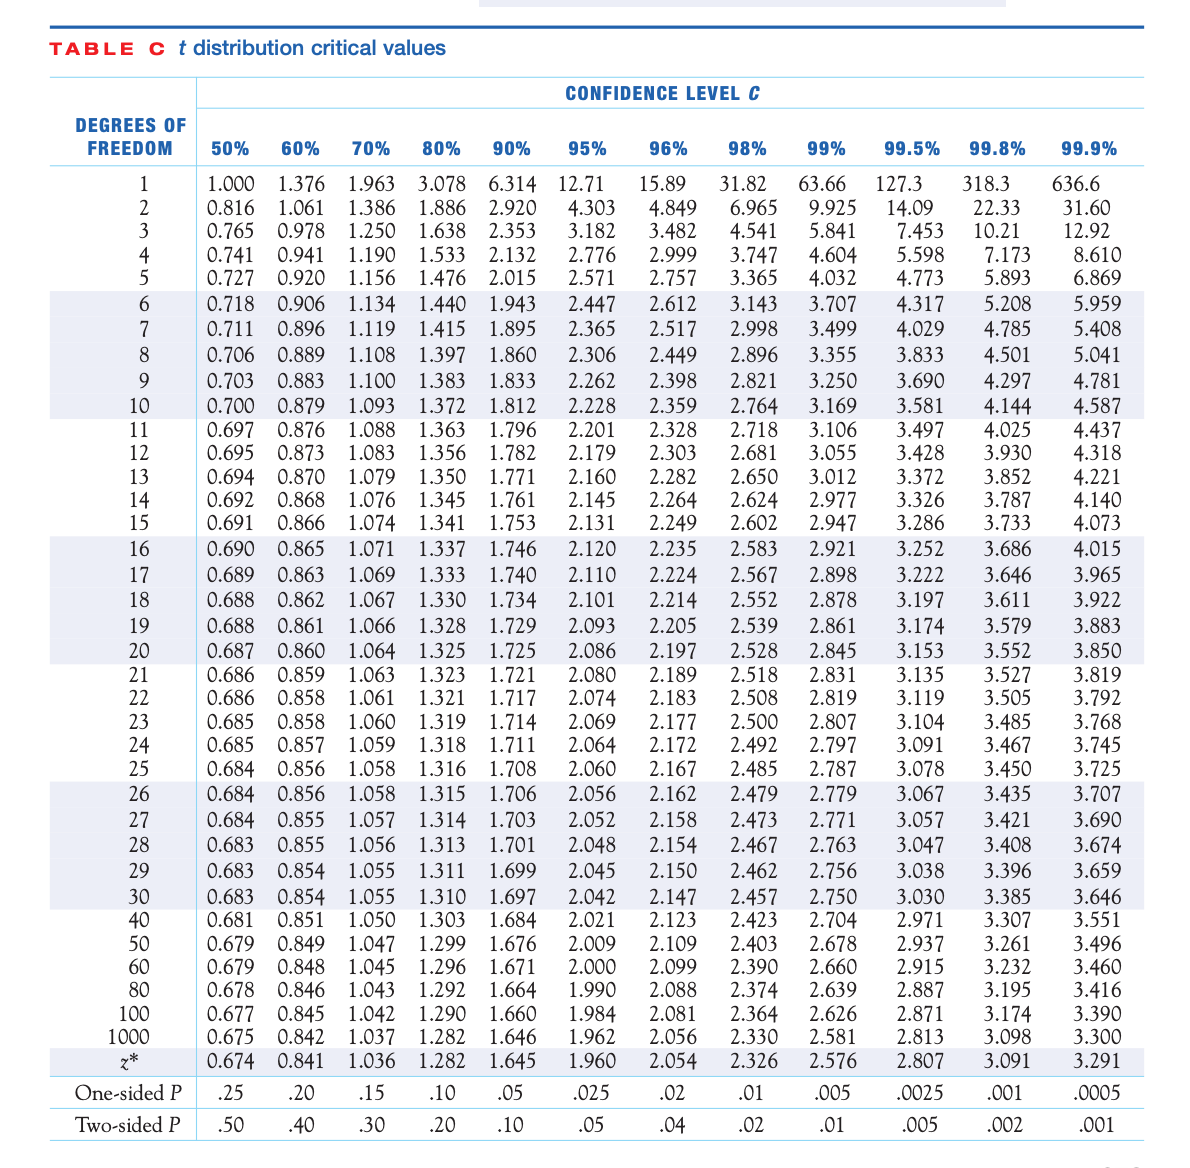
Transcribed Image Text:TABLE c t distribution critical values
CONFIDENCE LEVEL C
DEGREES OF
FREEDOM
50%
60%
70%
80%
90%
95%
96%
98%
99%
99.5%
99.8%
99.9%
1.376 1.963
1.386
1.250
15.89
4.849
3.482
318.3
3.078 6.314 12.71
1.886 2.920
1.638 2.353
1.533 2.132
1.476 2.015
31.82
6.965
4.541
3.747
3.365
127.3
14.09
7.453
5.598
4.773
4.317
1.000
63.66
636.6
4.303
3.182
9.925
5.841
4.604
4.032
3.707
31.60
12.92
2
0.816
1.061
22.33
3
0.978
0.765
0.741 0.941
0.727 0.920 1.156
10.21
1.190
8.610
6.869
4
2.776
2.571
2.999
7.173
5.893
2.757
2.612
2.517
6.
3.143
5.208
5.959
0.718 0.906 1.134 1.440 1.943
1.415 1.895
1.397 1.860
2.447
2.365
4.785
4.501
5.408
5.041
0.711 0.896 1.119
2.998
3.499
3.355
4.029
8
0.706 0.889
1.108
2.306
2.449
2.896
3.833
0.703
0.883
1.100
1.383
1.833
2.262
2.398
2.821
3.250
3.690
4.297
4.144
4.025
3.930
4.781
4.587
4.437
4.318
4.221
4.140
4.073
4.015
3.965
1.812
1.796
1.782
1.372
2.228
2.201
2.179
2.160
2.145
2.359
2.328
2.303
2.282
2.264
2.249
2.764
3.581
3.497
3.428
3.372
3.326
3.286
10
0.700 0.879 1.093
0.697
0.695
3.169
1.363
0.873 1.083 1.356
0.694 0.870 1.079 1.350 1.771
1.076 1.345
1.074 1.341 1.753
3.106
3.055
3.012
11
0.876 1.088
2.718
2.681
2.650
2.624
12
3.852
3.787
3.733
13
0.868
0.866
2.977
2.947
1.761
14
15
0.692
0.691
2.131
2.602
16
0.690
0.865 1.071
1.337 1.746
2.120
2.235
2.583
2.921
3.252
3.686
0.689
0.688
17
0.863
1.069 1.333
2.224
2.567
3.222
1.740
1.330 1.734
2.110
2.898
3.646
3.611
18
0.862
1.067
2.101
2.214
2.552
2.878
3.197
3.922
3.579
3.552
0.861
1.066
2.093
2.205
2.539
3.883
3.850
19
0.688
1.328 1.729
2.861
3.174
3.153
3.135
1.325 1.725
2.528
2.518
2.508
2.500
2.492
20
0.860
1.064
2.086
2.845
0.687
0.686
0.686
0.685
0.685
0.684
0.684
2.197
3.527
3.505
0.859
1.063
1.061
21
1.323
1.721
2.080
2.189
2.831
3.819
2.819
2.807
2.797
2.787
2.779
0.858
0.858
2.074
2.069
2.064
2.060
2.183
2.177
2.172
2.167
22
1.321
1.717
1.319 1.714
1.318
3.119
1.060
0.857 1.059
1.058
3.485
3.467
3.450
3.792
3.768
3.745
3.725
23
3.104
3.091
24
25
1.711
0.856
1.316
1.708
2.485
3.078
0.856
1.058
1.315 1.706
2.056
3.435
3.421
3.408
26
2.162
2.479
3.067
3.707
0.684 0.855 1.057 1.314 1.703
0.683 0.855 1.056
3.057
3.047
27
2.052
2.158
2.473
2.771
3.690
2.048
2.154
2.467
2.462
2.457
2.423
2.403
2.390
2.374
2.364
2.330
28
1.313
1.701
2.763
3.674
0.854 1.055
0.683 0.854 1.055 1.310
0.851
29
0.683
1.311
1.699
2.045
2.150
2.756
3.038
3.396
3.659
1.697
1.684
1.676
1.296 1.671
1.664
1.660
1.646
1.645
2.042
2.021
2.147
2.123
2.750
2.704
2.678
2.660
2.639
2.626
2.581
2.576
30
3.030
2.971
3.385
3.307
3.261
3.232
3.195
3.174
3.098
3.091
3.646
3.551
3.496
3.460
3.416
1.050 1.303
40
50
60
80
0.681
0.679
0.679
0.678
0.677
0.675
0.849 1.047 1.299
0.848 1.045
0.846 1.043 1.292
0.845 1.042 1.290
1.037
1.036
2.937
2.915
2.887
2.871
2.813
2.807
2.009
2.109
2.000
2.099
1.990
2.088
100
1000
z*
1.984
1.962
1.960
2.081
3.390
0.842
1.282
2.056
3.300
0.674
0.841
1.282
2.054
2.326
3.291
One-sided P
.25
.20
.15
.10
.05
.025
.02
.01
.005
.0025
.001
.0005
Two-sided P
.50
.40
.30
.20
.10
.05
.04
.02
.01
.005
.002
.001
8우
Transcribed Image Text:The one-sample t statistic for testing the hypotheses below from a sample of n = 19 observations has the value t = 1.6.
Но: и 3D о
Hạ: µ > 0
(a) What are the degrees of freedom for this statistic?
df =
(b) Give the two critical values t* from Table C that bracket t. (Enter your answers to three decimal places.)
< t* <
What are the one-sided P-values for these two entries? (Enter your answers to three decimal places.)
< P-value <
Expert Solution
This question has been solved!
Explore an expertly crafted, step-by-step solution for a thorough understanding of key concepts.

This is a popular solution!

Trending now
This is a popular solution!

Step by step
Solved in 4 steps with 2 images

Recommended textbooks for you
Linear Algebra: A Modern Introduction
Algebra
ISBN:
9781285463247
Author:
David Poole
Publisher:
Cengage Learning
Linear Algebra: A Modern Introduction
Algebra
ISBN:
9781285463247
Author:
David Poole
Publisher:
Cengage Learning