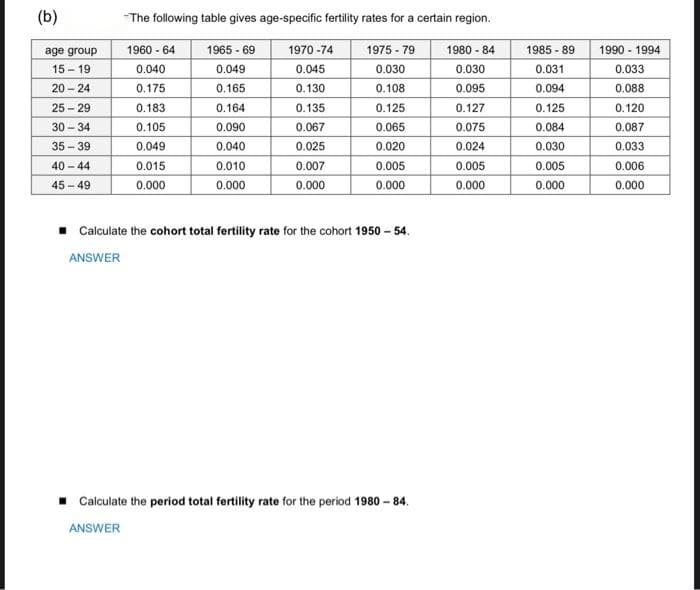
(b) The following table gives age-specific fertility rates for a certain region. 1965 - 69 1975 - 79 1980 - 84 1990 - 1994 age group 1960 - 64 1970 -74 1985 -89 15 - 19 0.040 0.049 0.045 0.030 0.030 0.031 0.033 20 - 24 0.175 0.165 0.130 0.108 0.095 0.094 0.088 25 - 29 0.183 0.164 0.135 0.125 0.127 0.125 0.120 30 - 34 0.105 0.090 0.067 0.065 0.075 0.084 0.087 35 - 39 0.049 0.040 0.025 0.020 0.024 0.030 0.033 40 - 44 0.015 0.010 0.007 0.005 0.005 0.005 0.006 45-49 0.000 0.000 0.000 0.000 0.000 0.000 0.000 . Calculate the cohort total fertility rate for the cohort 1950 - 54. ANSWER Calculate the period total fertility rate for the period 1980 -84. ANSWER


Q: Cumulative Cumulative Cumulative Relative Percentage Phone Bill Frequency Frequency Frequency…
A: Given Table is : (i) From the given table, we have total frequency is 200. So, the number of people…
Q: The table gives the population in a small coastal community for the period 1997 - 2006. Figures…
A:
Q: The economic dynamism, which is the index of productive growth (in dollars) for countries that are…
A: Hello! As you have posted more than 3 sub parts, we are answering the first 3 sub-parts. In case…
Q: The table gives the population in a small coastal community for the period 1997 - 2006. Figures…
A: a) 49 b) -96. 5
Q: Table 1. Survivorship table Number of deaths (D) # Of individuals who died during interval Age…
A: “Since you have posted a question with multiple sub-parts, we will solve first three sub-parts for…
Q: For the Hawkins Company, the monthly percentages of all shipments received on time over the past 12…
A: The given data is: .
Q: Statistics for a hypothetical population, July 1 to June 30 Total 1-year population Population of…
A:
Q: The accompanying data represent the annual rates of return of two companies' stock for the past 12…
A: Hello. Since your question has multiple sub-parts, we will solve first three sub-parts for you. If…
Q: Age Young Old All ages Population 12,000 13,000 25,000 Columbus, GA No. of deaths from Diabetes 200…
A: Age specific rate explain the measurement for various groups rate. It is calculated by dividing the…
Q: Statistics for a hypothetical population, July 1 to June 30 Total 1-year population Population of…
A: Since you have posted a question with multiple subparts, we will solve first three subparts for you.…
Q: Example 20.2 Using the data given in Table 20.2, calculate the price index for year 2, the base year…
A:
Q: 3.9 Kenya 55 380 2.9 6.8 Indonesia 35 530 4.1 3.4 Panama 30 1910 3.1 8.6 Chile 25…
A: Country Birth rate GNP Growth Income ratio Bangladesh 47 140 0.3 2.3 Tanzania 47 280 1.9 3.2…
Q: Mean Shipping Cost per Unit ($) Base-Period Quantities (Year 1) Products Year 1 Year 5 A 2,500 10.50…
A:
Q: 12 The following table gives the population of a town during the last 5 Estimate the popularion for…
A:
Q: Considering the aggregated demand for coffee beans for the following months shown below, what would…
A: Data is given for 6 months, We have to calculate forcast for 8 th month. We will use 3 months moving…
Q: From the following data find out (i) purchasing power of money, (ii) real income, and (iii) real…
A:
Q: Given the data in Table 2 for Suriname, calculate the following measures for the period 1973-1980.…
A: As per the Bartleby guildlines we have to solve first three subparts and rest can be reposted...…
Q: The economic dynamism, which is the index of productive growth (in dollars) for countries that are…
A: From the provided information, Sample size (n) = 26 Level of significance (α) = 0.05
Q: (c) In what year between 1977 and 1985 were basic cable TVsubscriptions growing the fastest? What…
A: (c) In what year between 1977 and 1985 were basic cable TVsubscriptions growing the fastest? What…
Q: Listed below is the selling price for a share of PepsiCO Inc. at the close of each year. Year…
A: The data is given as : Year Time Price 1990 1 12.9135 1991 2 16.825 1992 3 20.6125 1993…
Q: Suppose that you are given the following sales data for the last three years, with Q1 being Quarter…
A: Given,
Q: Moving to another question will save this response. Question 11 Using the information given below,…
A:
Q: 2. The following table shows the average monthly production of coal in tonnes for the year…
A:
Q: Example 18.11) Calculate the seasonal index number from the following data: Year Q2 1987 105 100 90…
A:
Q: When data consist of percentages, ratios, compounded growth rates, or other rates of change, the…
A: Introduction: The geometric mean is a mean or average that uses the product of its values,…
Q: In a study of claim payment times, you are given: (i) The data were not truncated or censored. (ii)…
A:
Q: The economic dynamism, which is the index of productive growth (in dollars) for countries that are…
A: iv) Sample mean: x-bar= 43.8727 from the excel function, =AVERAGE(J1:J26) v) Sample…
Q: The pharmaceutical expenditure funded by a public insurance was 3,000,000 m.u. (monetary units) this…
A: Given dataThe pharmaceutical expenditure funded by a public insurance was 3000000 m.ucorresponded to…
Q: Consider the following data. Period 1 rate of return -6.0. Period 2 rate of return -8.0. Period 3…
A:
Q: In a table of “Sales as a % of Moving Average” over a 5-year period the adjusted average of the four…
A:
Q: 3. Examine the following data, showing the enrollment of a University for the past 5 years.…
A: Hint: Fit the linear regression of the form y= a+bx. estimate a and b as; b=∑xi-xyi-y∑xi-x2 a= y-b…
Q: The economic dynamism, which is the index of productive growth (in dollars) for countries that are…
A: Sample x (x-x̄)2 1 25.8057 326.4562376 2 41.1648 7.338681 3 49.1361 27.69180129 4 50.9866…
Q: Compute the crude and standardized death rate! tions A and B from the following data : Age-group…
A: Answer:
Q: Calculate Crude death rate and Age-specific death rates for the following data Age group Population…
A:
Q: Suppose the following data in the table represent total revenues (in millions) by Teachers Credit…
A:
Q: Compute a 95% confidence interval for the mean economic dynamism of middle-income countries by…
A:
Q: Suppose we have the following data on the number of car crashes each month for the year 2020 in the…
A: We have to test that if number accident varies seasonally or it is constant over months for that we…
Q: Suppose that you are given the following sales data for the last three years, with Q1 being Quarter…
A:
Q: 53. Calculate seasonal index numbers from the following data : RATIO OF OBSERVED TO TREND VALUES (%)…
A:
Q: The following table provides age-specific male and female population of a country. a) Draw the…
A:
Q: The economic dynamism, which is the index of productive growth (in dollars) for countries that are…
A: (iv) Obtain the t score for the 95% confidence level. The t score for the 95% confidence level…
Q: The table below represents the monthly unemployment rates in the US from January of 2005 through May…
A: Find the absolute change in the unemployment rate during 2008 as follows, The formula for the…
Q: Table 1 displays data for money aggregates released by the Central Bank, Country A for the years…
A:
Q: A group of researchers carried out a survey of household expenditure for an average family and the…
A: “Since you have posted a question with multiple sub-parts, we will solve first three sub-parts for…
Q: QUESTION: From the given table, compute for the crude birth rate for every 1000 population in…
A: The birth rate explains the number of birth per 1000. The crude birth rate per 1000 is calculated by…
Q: 15. Estimate the standardized death rates from the following data : Death Rate per 1000 008 Age…
A:
Q: 2.2 The price (in rands) in June of a 1 kg packet of laundry in KwaDukuza is shown is shown below…
A: Note: " Since you have posted many sub-parts. we will solve the first three sub-parts for you. To…
Q: The Bank of Canada is interested in studying the relationship between mortgage rates and median home…
A: Hi! Thank you for the question, as per the honor code, we are allowed to answer three sub-parts at a…
Q: . Consider the following data. Period Rate of Return % 1…
A: Rate of return (%) Xi 26 28 24 2 5.4 Mean growth rate=?
1

Step by step
Solved in 2 steps with 2 images

- The table below shows percentage changes (xi) in the Dow-Jones index over the first five trading days of each of thirteen years and also the corresponding percentage changes (yi) in another index. xi yi 1.5 14.9 0.2 -9.2 -0.1 19.6 2.8 20.3 2.2 -3.7 -1.6 27.7 -1.3 22.6 5.6 2.3 -1.4 11.9 1.4 27.0 1.5 -4.3 -4.7 20.3 1.1 4.2 1- Calculate the sample correlation and interpret. 2- Test at the 1% significance level, against a two-sided alternative, the null hypothesis that the population correlation is 0. Thanks.The economic dynamism, which is the index of productive growth (in dollars) for countries that are designated by the World Bank as middle-income are in following table ("SOCR data 2008," 2013): Table: Economic Dynamism ($) of Middle Income Countries 25.8057 37.4511 51.915 43.6952 47.8506 43.7178 58.0767 41.1648 38.0793 37.7251 39.6553 42.0265 48.6159 43.8555 49.1361 61.9281 41.9543 44.9346 46.0521 48.3652 43.6252 50.9866 59.1724 39.6282 33.6074 21.6643 Compute a 95% confidence interval for the mean economic dynamism of middle-income countries by answering the following questions: (i) Determine sample mean x :i Determine sample mean x : Enter in decimal form to nearest ten-thousandth. Do not enter units of measure. Examples of correctly entered answers: 0.0015 0.0000 136.7000 99.0070 36.9128 (ii) Determine sample standard deviation s : Enter in decimal form to nearest ten-thousandth. Examples of correctly entered answers: 0.0001…The economic dynamism, which is the index of productive growth (in dollars) for countries that are designated by the World Bank as middle-income are in following table ("SOCR data 2008," 2013). Table: Economic Dynamism of Middle Income Countries 25.8057 37.4511 51.915 43.6952 47.8506 43.7178 58.0767 41.1648 38.0793 37.7251 39.6553 42.0265 48.6159 43.8555 49.1361 61.9281 41.9543 44.9346 46.0521 48.3652 43.6252 50.9866 59.1724 39.6282 33.6074 21.6643 Countries that are considered high-income have a mean economic dynamism of 60.29. Do the data show that the mean economic dynamism of middle-income countries is less than the mean for high-income countries? Test at the 5% level. (iv) Determine sample mean x :iv Determine sample mean x : Enter answer to nearest ten-thousandth, without "$" sign. Examples of correctly entered answers: 11.2385 0.0079 3.0500 7.4000 (v) Determine sample…
- The economic dynamism, which is the index of productive growth (in dollars) for countries that are designated by the World Bank as middle-income are in following table ("SOCR data 2008," 2013). Table: Economic Dynamism of Middle Income Countries 25.8057 37.4511 51.915 43.6952 47.8506 43.7178 58.0767 41.1648 38.0793 37.7251 39.6553 42.0265 48.6159 43.8555 49.1361 61.9281 41.9543 44.9346 46.0521 48.3652 43.6252 50.9866 59.1724 39.6282 33.6074 21.6643 Countries that are considered high-income have a mean economic dynamism of 60.29. Do the data show that the mean economic dynamism of middle-income countries is less than the mean for high-income countries? Test at the 5% level. (i) Which of the following statements correctly defines the null hypothesis HO? A. μ < $60.29 B. p < $60.29 C. μ = $60.29 D. p = $60.29 Enter letter corresponding to correct answer (ii) Which of the following…The economic dynamism, which is the index of productive growth (in dollars) for countries that are designated by the World Bank as middle-income are in following table ("SOCR data 2008," 2013): Table: Economic Dynamism ($) of Middle Income Countries 25.8057 37.4511 51.915 43.6952 47.8506 43.7178 58.0767 41.1648 38.0793 37.7251 39.6553 42.0265 48.6159 43.8555 49.1361 61.9281 41.9543 44.9346 46.0521 48.3652 43.6252 50.9866 59.1724 39.6282 33.6074 21.6643 Compute a 95% confidence interval for the mean economic dynamism of middle-income countries by answering the following questions (iv) Determine t score corresponding to desired confidence level Enter value in decimal form rounded to nearest hundredth. Examples of correctly entered answers: 2.01 0.37 0.60 0.00 (v) Determine error bound of the mean: Enter value in decimal form rounded to nearest ten-thousandth. Examples of correctly entered answers: 0.0000 0.0003 3.0060 2.0700…The economic dynamism, which is the index of productive growth (in dollars) for countries that are designated by the World Bank as middle-income are in following table ("SOCR data 2008," 2013): Table: Economic Dynamism ($) of Middle Income Countries 25.8057 37.4511 51.915 43.6952 47.8506 43.7178 58.0767 41.1648 38.0793 37.7251 39.6553 42.0265 48.6159 43.8555 49.1361 61.9281 41.9543 44.9346 46.0521 48.3652 43.6252 50.9866 59.1724 39.6282 33.6074 21.6643 Compute a 95% confidence interval for the mean economic dynamism of middle-income countries by answering the following questions: (vii) Using the confidence interval, select the correct description of the result of the survey: A. We estimate with 95% confidence that the true proportion mean economic dynamism for middle-income countries is between $40.21 and $47.54. B. We estimate with 95% confidence that the proportional economic dynamism for middle-income countries is between $40.21 and $47.54. C. We estimate…
- The economic dynamism, which is the index of productive growth (in dollars) for countries that are designated by the World Bank as middle-income are in following table ("SOCR data 2008," 2013). Table: Economic Dynamism of Middle Income Countries 25.8057 37.4511 51.915 43.6952 47.8506 43.7178 58.0767 41.1648 38.0793 37.7251 39.6553 42.0265 48.6159 43.8555 49.1361 61.9281 41.9543 44.9346 46.0521 48.3652 43.6252 50.9866 59.1724 39.6282 33.6074 21.6643 Countries that are considered high-income have a mean economic dynamism of 60.29. Do the data show that the mean economic dynamism of middle-income countries is less than the mean for high-income countries? Test at the 5% level. (x) Select the statement that most correctly interprets the result of this test: A. The result is statistically significant at .05 level of significance. Evidence supports the claim that the mean economic dynamism for a middle-income…The economic dynamism, which is the index of productive growth (in dollars) for countries that are designated by the World Bank as middle-income are in following table ("SOCR data 2008," 2013). Table: Economic Dynamism of Middle Income Countries 25.8057 37.4511 51.915 43.6952 47.8506 43.7178 58.0767 41.1648 38.0793 37.7251 39.6553 42.0265 48.6159 43.8555 49.1361 61.9281 41.9543 44.9346 46.0521 48.3652 43.6252 50.9866 59.1724 39.6282 33.6074 21.6643 Countries that are considered high-income have a mean economic dynamism of 60.29. Do the data show that the mean economic dynamism of middle-income countries is less than the mean for high-income countries? Test at the 5% level. (vii) Calculate and enter test statistic Enter value in decimal form rounded to nearest ten-thousandth, with appropriate sign (no spaces). Examples of correctly entered answers: –2.0140 –0.0307 +0.6000 +1.0009…A sample containing years to maturity and yield for 40 corporate bonds are contained in the data given below. Years to Maturity Yield Years to Maturity Yield 27.75 6.075 5.00 6.888 10.50 5.966 10.50 3.477 18.50 4.444 8.00 2.893 13.50 5.569 18.50 4.945 2.75 7.673 5.50 1.991 10.00 6.969 26.50 1.320 13.50 2.956 21.25 1.867 2.75 2.241 13.25 2.189 24.25 0.916 11.75 7.499 1.75 5.323 25.75 5.686 10.25 1.720 13.50 5.195 16.75 3.987 20.00 1.710 22.50 6.405 27.00 1.121 21.25 4.456 1.25 4.146 23.75 2.725 6.25 7.115 8.75 5.497 5.25 1.211 27.75 6.392 4.50 5.998 24.00 0.989 9.00 2.458 15.00 6.169 8.00 1.162 29.00 5.105 8.75 4.978 a. What is the sample mean years to maturity for corporate bonds and what is the sample standard deviation? Mean (to 4 decimals) Standard deviation (to 4 decimals) b. Develop a 95%…
- An asset has a depreciable basis of $13,200 and qualifies as 3-year MACRS property. The MACRS percentages are: 16.67, 33.33, 33.33. and 16.67 percent for years 1 to 4, respectively. What is the year 3 ending book value?Age (YRS) Mass (KG) Cigarettes (Per Day) Risk Index (R.I.) (--) 46 113 40 974.5 35 96 32 670.68 43 81 26 409.26 39 93 50 1484.5 22 66 25 500 58 55 33 631.87 60 72 15 350.75 54 93 19 347.09 32 55 12 308.78 63 115 24 580.74 30 105 20 320.5 24 90 19 381.59 55 65 15 274.25 30 115 6 322.66 40 115 21 411.11 34 80 22 396.48 31 88 22 906 70 57 33 616.87 35 116 43 1072.07 57 101 31 589.41 44 68 36 718.56 66 118 33 790.37 46 120 44 1129.84 20 72 19 487 64 63 35 665.25 30 113 3 204.26 32 70 20 312 37 68 23 299.67 52 88 26 418.76 64 70 46 1299.36 23 87 23 422.17 42 53 50 1500.5 54 64 15 299.75 35 95 49 1536.99 51 95 39 912.69 61 105 20…Suppose we have the following returns for large-company stocks and Treasury bills over a six-year period: Year Large-Company US Treasury Bill 1 3.97 6.59 2 14.34 4.42 3 19.23 4.29 4 −14.45 7.32 5 −31.94 5.28 6 37.47 5.38 a. Calculate the arithmetic average returns for large-company stocks and T-bills over this time period. (Do not round intermediate calculations and enter your answers as a percent rounded to 2 decimal places, e.g., 32.16.) b. Calculate the standard deviation of the returns for large-company stocks and T-bills over this time period. (Do not round intermediate calculations. Enter your answers as a percent rounded to 2 decimal places, e.g., 32.16.) c-1. Calculate the observed risk premium in each year for the large-company stocks versus the T-bills. What was the arithmetic average risk premium over this period? (A negative answer should be indicated by a minus sign. Do not round intermediate calculations and enter your answer…