temperature. (ii) Predict the electricity consumption of the office when the maximum temperature is 30°C. How confident are you in this prediction?
temperature. (ii) Predict the electricity consumption of the office when the maximum temperature is 30°C. How confident are you in this prediction?

Managerial Economics: Applications, Strategies and Tactics (MindTap Course List)
14th Edition
ISBN:9781305506381
Author:James R. McGuigan, R. Charles Moyer, Frederick H.deB. Harris
Publisher:James R. McGuigan, R. Charles Moyer, Frederick H.deB. Harris
Chapter5: Business And Economic Forecasting
Section: Chapter Questions
Problem 1.2CE: Plot the logarithm of arrivals for each transportation mode against time, all on the same graph....

Related questions
Question
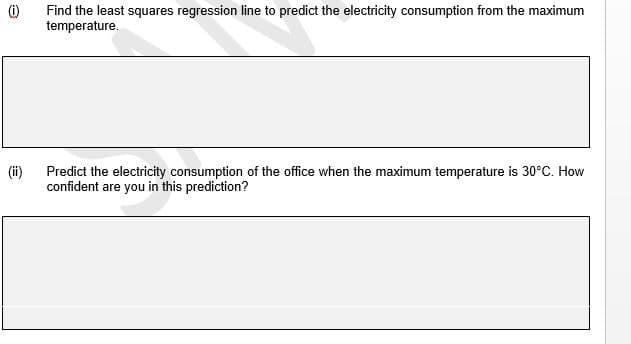
Transcribed Image Text:(i)
Find the least squares regression line to predict the electricity consumption from the maximum
temperature.
(ii)
Predict the electricity consumption of the office when the maximum temperature is 30°C. How
confident are you in this prediction?
Transcribed Image Text:Question 4 - Type Your Answers in Space Provided
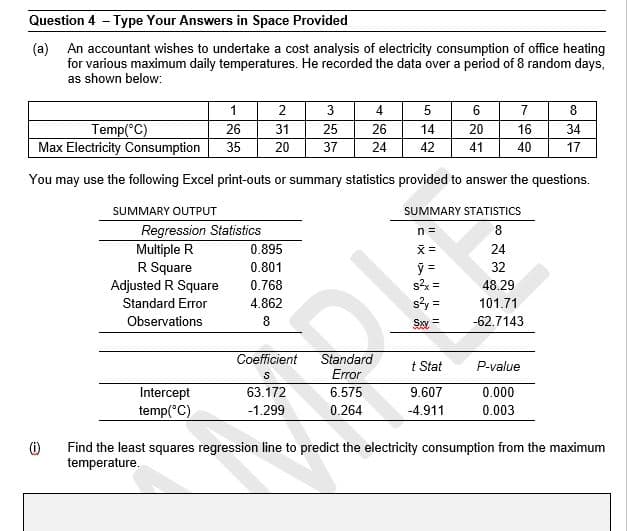
(a)
An accountant wishes to undertake a cost analysis of electricity consumption of office heating
for various maximum daily temperatures. He recorded the data over a period of 8 random days,
as shown below:
2
3
4
5
6
8
Temp(°C)
Max Electricity Consumption
26
31
25
26
14
20
16
34
35
20
37
24
42
41
40
17
You may use the following Excel print-outs or summary statistics provided to answer the questions.
SUMMARY OUTPUT
SUMMARY STATISTICS
Regression Statistics
Multiple R
R Square
Adjusted R Square
Standard Error
n =
8.
0.895
24
0.801
32
0.768
s2x =
48.29
4.862
s?y =
101.71
%3!
Observations
8
Sxy =
-62.7143
Coefficient
Standard
Error
t Stat
P-value
6.575
Intercept
temp(°C)
63.172
9.607
0.000
-1.299
0.264
-4.911
0.003
Find the least squares regression line to predict the electricity consumption from the maximum
temperature.
Expert Solution
This question has been solved!
Explore an expertly crafted, step-by-step solution for a thorough understanding of key concepts.

Step by step
Solved in 2 steps

Knowledge Booster


Learn more about
Need a deep-dive on the concept behind this application? Look no further. Learn more about this topic, economics and related others by exploring similar questions and additional content below.Recommended textbooks for you
Managerial Economics: Applications, Strategies an…
Economics
ISBN:
9781305506381
Author:
James R. McGuigan, R. Charles Moyer, Frederick H.deB. Harris
Publisher:
Cengage Learning
Managerial Economics: Applications, Strategies an…
Economics
ISBN:
9781305506381
Author:
James R. McGuigan, R. Charles Moyer, Frederick H.deB. Harris
Publisher:
Cengage Learning