The forecast with out seasonality is modeled as: Sales 6 t+ 236.00, where t= time in months, beginning in January 2015. Seasonality for the first three months are given in the table below. Determine a seasonalized forecast for Feb of 2016. Month Seasonal Factor January 1.9000 February 0.6262 March 0.1000 Submit Answer format: Number: Round to: 1 decimal places.
The forecast with out seasonality is modeled as: Sales 6 t+ 236.00, where t= time in months, beginning in January 2015. Seasonality for the first three months are given in the table below. Determine a seasonalized forecast for Feb of 2016. Month Seasonal Factor January 1.9000 February 0.6262 March 0.1000 Submit Answer format: Number: Round to: 1 decimal places.

Managerial Economics: Applications, Strategies and Tactics (MindTap Course List)
14th Edition
ISBN:9781305506381
Author:James R. McGuigan, R. Charles Moyer, Frederick H.deB. Harris
Publisher:James R. McGuigan, R. Charles Moyer, Frederick H.deB. Harris
Chapter5: Business And Economic Forecasting
Section: Chapter Questions
Problem 3E: Metropolitan Hospital has estimated its average monthly bed needs as N=1,000+9X where...

Related questions
Question
Answer the question no 2
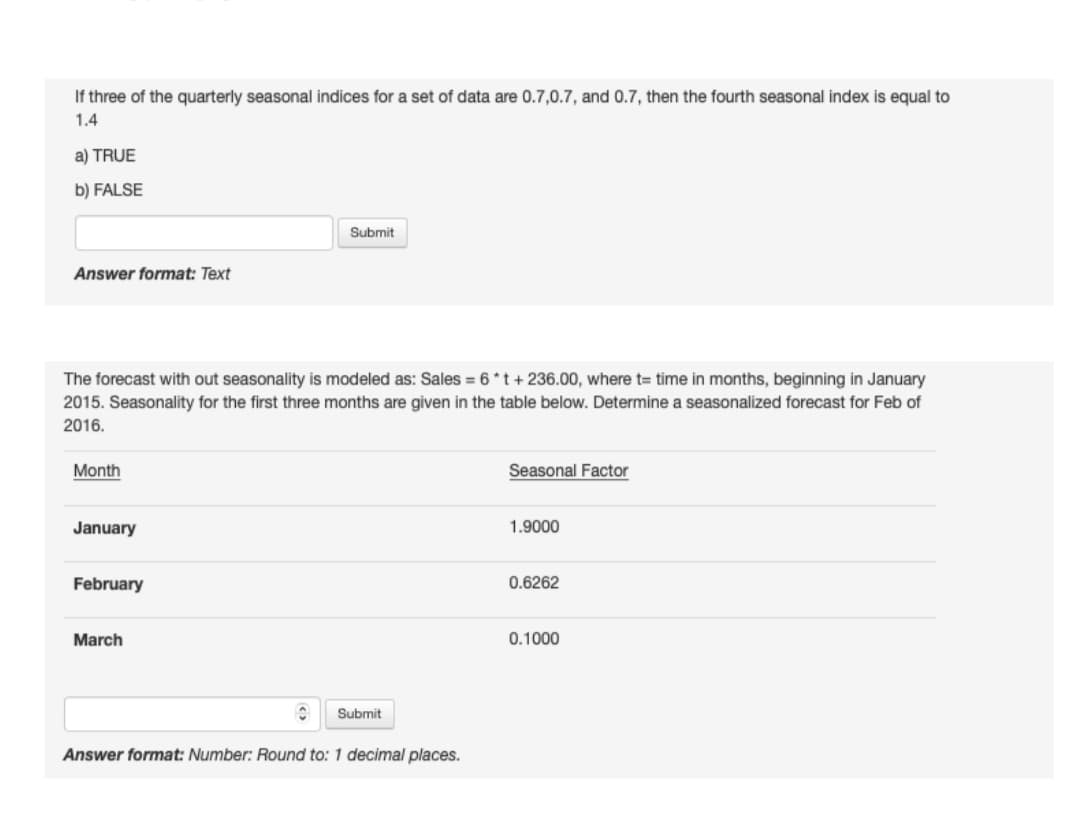
Transcribed Image Text:If three of the quarterly seasonal indices for a set of data are 0.7,0.7, and 0.7, then the fourth seasonal index is equal to
1.4
a) TRUE
b) FALSE
Submit
Answer format: Text
The forecast with out seasonality is modeled as: Sales = 6 *t + 236.00, where t= time in months, beginning in January
2015. Seasonality for the first three months are given in the table below. Determine a seasonalized forecast for Feb of
2016.
Month
Seasonal Factor
January
1.9000
February
0.6262
March
0.1000
Submit
Answer format: Number: Round to: 1 decimal places.
Expert Solution
This question has been solved!
Explore an expertly crafted, step-by-step solution for a thorough understanding of key concepts.

This is a popular solution!

Trending now
This is a popular solution!

Step by step
Solved in 2 steps

Knowledge Booster


Learn more about
Need a deep-dive on the concept behind this application? Look no further. Learn more about this topic, economics and related others by exploring similar questions and additional content below.Recommended textbooks for you
Managerial Economics: Applications, Strategies an…
Economics
ISBN:
9781305506381
Author:
James R. McGuigan, R. Charles Moyer, Frederick H.deB. Harris
Publisher:
Cengage Learning
Managerial Economics: Applications, Strategies an…
Economics
ISBN:
9781305506381
Author:
James R. McGuigan, R. Charles Moyer, Frederick H.deB. Harris
Publisher:
Cengage Learning