The acceptable level for insect filth in a certain food item is 4 insect fragments (larvae, eggs, body parts, and so on) per 10 grams. A simple random sample of 40 ten-gram portions of the food item is obtained and results in a sample mean of x = 4.2 insect fragments per ten-gram portion. Complete parts (a) through (c) below. Click here to view the standard normal distribution table (page 1). Click here to view the standard normal distribution table (page 2). (a) Why is the sampling distribution of x approximately normal? A. The sampling distribution is approximately normal because the popluation is normally distributed. B. The sampling distribution is assumed to be approximately normal. C. The sampling distribution is approximately normal because the sample size is large enough. D. The sampling distribution is approximately normal because the population is normally distributed and the sample size is large enough. (b) What is the mean and standard deviation of the sampling distribution of x assuming µ = 4 and o = /4? H; = (Round to three decimal places as needed.)
The acceptable level for insect filth in a certain food item is 4 insect fragments (larvae, eggs, body parts, and so on) per 10 grams. A simple random sample of 40 ten-gram portions of the food item is obtained and results in a sample mean of x = 4.2 insect fragments per ten-gram portion. Complete parts (a) through (c) below. Click here to view the standard normal distribution table (page 1). Click here to view the standard normal distribution table (page 2). (a) Why is the sampling distribution of x approximately normal? A. The sampling distribution is approximately normal because the popluation is normally distributed. B. The sampling distribution is assumed to be approximately normal. C. The sampling distribution is approximately normal because the sample size is large enough. D. The sampling distribution is approximately normal because the population is normally distributed and the sample size is large enough. (b) What is the mean and standard deviation of the sampling distribution of x assuming µ = 4 and o = /4? H; = (Round to three decimal places as needed.)

MATLAB: An Introduction with Applications
6th Edition
ISBN:9781119256830
Author:Amos Gilat
Publisher:Amos Gilat
Chapter1: Starting With Matlab
Section: Chapter Questions
Problem 1P

Related questions

Question
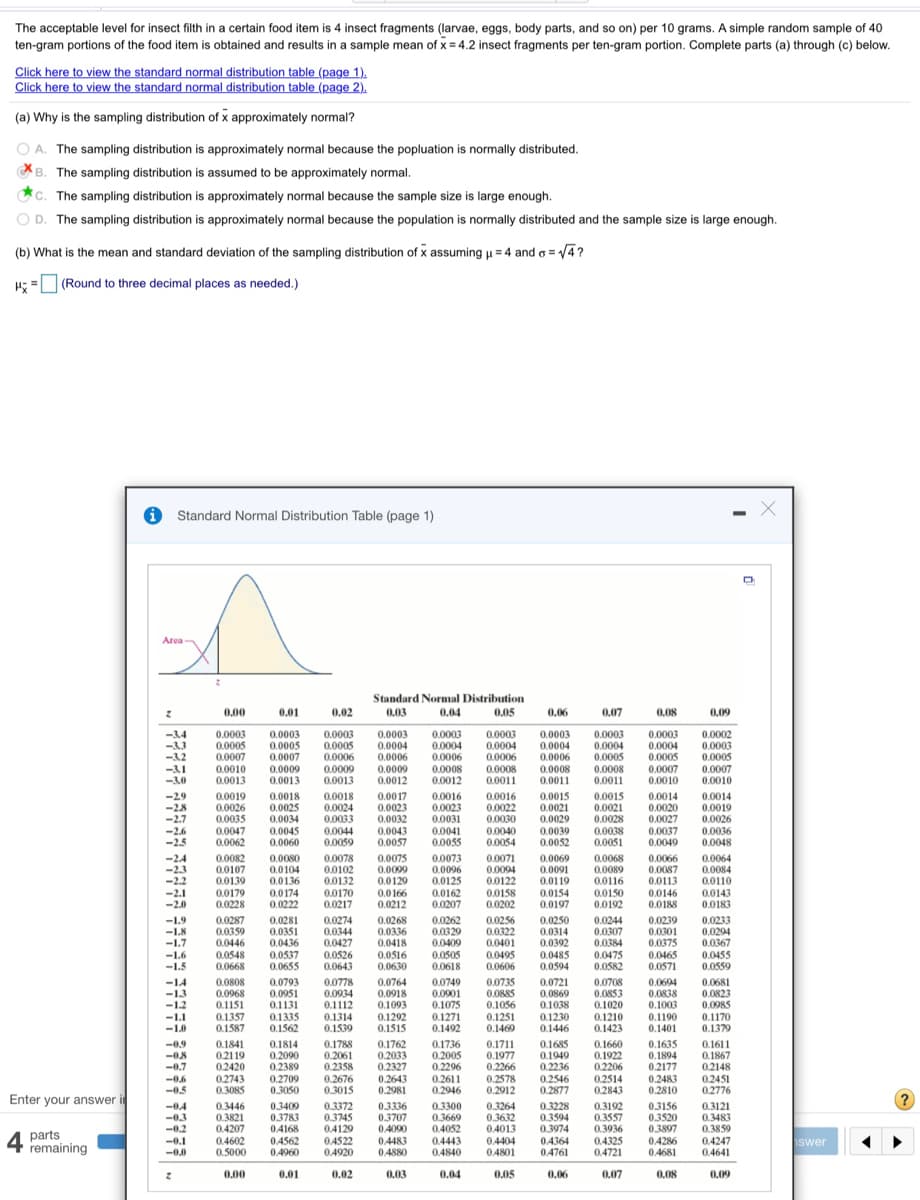
Transcribed Image Text:The acceptable level for insect filth in a certain food item is 4 insect fragments (larvae, eggs, body parts, and so on) per 10 grams. A simple random sample of 40
ten-gram portions of the food item is obtained and results in a sample mean of x = 4.2 insect fragments per ten-gram portion. Complete parts (a) through (c) below.
Click here to view the standard normal distribution table (page 1).
Click here to view the standard normal distribution table (page 2).
(a) Why is the sampling distribution of x approximately normal?
O A. The sampling distribution is approximately normal because the popluation is normally distributed.
B. The sampling distribution is assumed to be approximately normal.
C. The sampling distribution is approximately normal because the sample size is large enough.
O D. The sampling distribution is approximately normal because the population is normally distributed and the sample size is large enough.
(b) What is the mean and standard deviation of the sampling distribution of x assuming u = 4 and o = 4?
H: = (Round to three decimal places as needed.)
O Standard Normal Distribution Table (page 1)
Area
Standard Normal Distribution
0.03
0.00
0.01
0.02
0.04
0.05
0,06
0.07
0.08
0.09
-3.4
-33
-32
-31
-30
0.0003
0.0005
0.0007
0.0010
0.0013
0.0003
0.0005
0.0007
0.0009
0.0003
0.0005
0.0006
0.0009
0,0013
0.0003
0.0004
0.0006
0.0009
0.0012
0.0003
0.0004
0.0006
0.0008
0.0012
0.0003
0.0004
0.0006
0.0008
0.0011
0.0003
0.0004
0.0006
0.0008
0.0011
0.0003
0.0004
0.0005
0.0008
0.0011
0.0003
0.0004
0.0005
0.0007
0.0010
0.0002
0.0003
0.0005
0.0007
0.0010
0.0013
-29
-28
-2.7
-26
-2.5
0.0019
0.0026
0.0035
0.0047
0.0062
0.0018
0.0025
0.0034
0.0045
0.0060
0.0018
0.0024
0.0033
0.0044
0.0059
0.0017
0.0023
0.0032
0.0043
0.0057
0.0016
0.0023
0.0031
0.0041
0.0055
0.0016
0.0022
0.0030
0.0040
0.0054
0.0015
0.0021
0.0029
0.0039
0.0052
0.0015
0.0021
0.0028
0.0038
0.0051
0.0014
0.0020
0.0027
0.0037
0.0049
0.0014
0.0019
0.0026
0.0036
0.0048
-24
-2.3
-2.2
-2.1
-2.0
0.0082
0.0107
0.0139
0.0080
0.0104
0.0136
0.0174
0.0222
0.0078
0.0102
0.0132
0.0170
0.0217
0.0075
0.0073
0.0096
0.0125
0.0162
0.0207
0.0071
0.0094
0.0122
0.0158
0.0202
0.0069
0.0091
0.0119
0.0154
0.0197
0.0066
0.0087
0.0113
0.0068
0.0064
0.0089
0.0116
0.0150
0.0192
0.0099
0.0084
0.0110
0.0143
0.0183
0.0129
0.0179
0.0228
0.0166
0.0212
0.0146
0.0188
-1.9
-1.8
-1.7
-1.6
-1.5
0.0287
0.0359
0.0446
0.0548
0.0668
0.0281
0.0351
0.0436
0.0537
0.0655
0.0274
0.0344
0.0427
0.0526
0.0643
0.0268
0.0336
0.0418
0.0516
0.0630
0.0262
0.0329
0.0409
0.0505
0.0618
0.0256
0.0322
0.0401
0.0495
0.0606
0.0250
0.0314
0.0392
0.0485
0.0594
0.0244
0.0307
0.0384
0.0475
0.0582
0.0239
0.0301
0.0375
0.0233
0.0294
0.0367
0.0455
0.0559
0.0465
0.0571
-14
-13
-1.2
-1.1
-1.0
0.0778
0.0934
0.1112
0.1314
0.1539
0.0808
0.0793
0.0951
0.1131
0.1335
0.1562
0.0764
0.0918
0.1093
0.0749
0.0901
0.1075
0.1271
0.1492
0.0735
0.0885
0.1056
0.1251
0.1469
0.0721
0.0869
0.1038
0.1230
0.1446
0.0708
0.0853
0.1020
0.1210
0.1423
0.0694
0.0838
0.1003
0.1190
0.1401
0.0681
0.0823
0.098S
0.1170
0.1379
0.0968
0.1151
0.1357
0.1587
0.1292
0.1515
-0.9
0.1841
02119
0.2420
0.2743
0.3085
0.1814
0.2090
0.2389
0.2709
0.3050
0.1788
0.2061
0.2358
0.2676
0.3015
0.1762
0.2033
0.2327
0.1736
0.2005
0.2296
0.2611
0.2946
0.1711
0.1977
0.2266
0.2578
0.2912
0.1685
0.1949
0.2236
0.2546
0.2877
0.1660
0.1922
0.2206
02514
0.2843
0.1635
0.1611
0.1867
0.2148
0.2451
0.2776
0.1894
-0.7
--0.6
-0.5
0.2643
0.2981
0.2177
0.2483
0.2810
Enter your answer in
-04
-0.3
-0.2
-0.1
0.3446
0.3821
0.4207
0.3409
0.3783
0.4168
0.4562
0.4960
0.3372
0.3745
0.4129
0.3336
0.3707
0.3300
0.3669
0.4052
0.3264
0.3632
0.4013
0.3228
0.3594
0.3974
0.4364
0.4761
0.3192
0.3557
0.3936
0.3156
0.3520
0.3897
0.3121
0.3483
0.3859
0.4090
parts
remaining
0.4602
0.5000
0.4522
0.4920
0.4483
0.4880
0.4443
0.4840
0.4404
0.4801
0.4325
0.4721
0.4286
0.4681
0.4247
0.4641
swer
-0.0
0.00
0.01
0.02
0.03
0.04
0.05
0.06
0.07
0.08
0.09
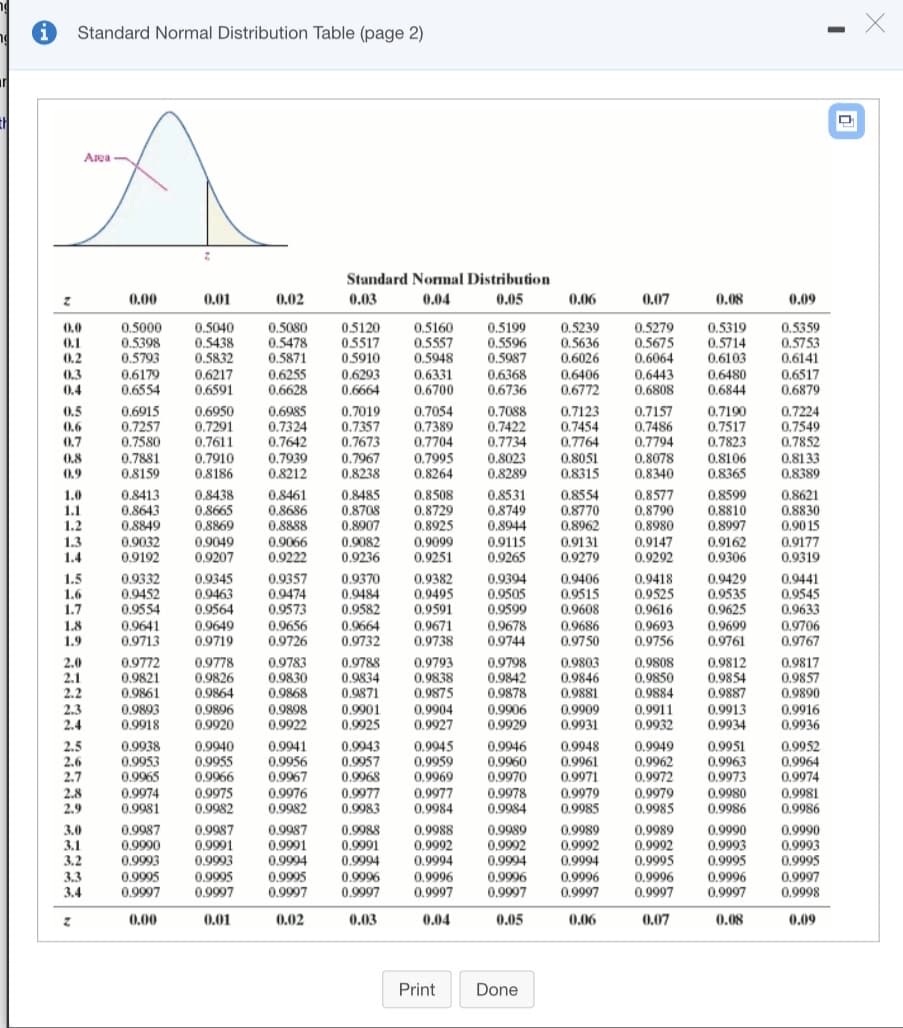
Transcribed Image Text:Standard Normal Distribution Table (page 2)
Area
Standard Nomal Distribution
0.00
0,01
0.02
0.03
0.04
0.05
0.06
0.07
0.08
0.09
0,5000
0.5398
0.5793
0.5040
0.5438
0.5832
0.6217
0.6591
0.5080
0.5478
0.5871
0.6255
0.6628
0.5120
0.5517
0.5910
0.6293
0.6664
0.5160
0.5557
0.5948
0.6331
0.6700
0.5199
0.5596
0.5987
0.5239
0.5636
0.6026
0.6406
0.6772
0.5279
0.5675
0.6064
0.6443
0.6808
0.5319
0.5714
0.6103
0.6480
0.6844
0.5359
0.5753
0.6141
0.6517
0.6879
0.0
0.1
0.2
0.3
0.4
0.6179
0.6554
0.6368
0.6736
0.6915
0.7257
0.7580
0.6950
0.7291
0.7611
0.7910
0.8186
0,6985
0.7324
0.7642
0.7939
0.8212
0.7019
0.7357
0.7673
0.7967
0.8238
0.7054
0.7389
0.7704
0.7995
0.8264
0.7088
0.7422
0.7734
0.8023
0.8289
0.7224
0.7549
0.7852
0.8133
0.8389
0.5
0.7123
0.7454
0.7764
0.8051
0.8315
0.7157
0,7486
0.7794
0.8078
0.7190
0.7517
0.7823
0.8106
0.8365
0.6
0.7
0.8
0.7881
0.8159
0.9
0.8340
1.0
1.1
1.2
0.8413
0.8643
0.8849
0.8438
0.8665
0.8869
0.8461
0,8686
0.8888
0.8485
0.8708
0.8907
0.8508
0.8729
0.8925
0.9099
0.9251
0.8531
0.8749
0.8944
0,8554
0.8770
0,8962
0.9131
0,9279
0.8577
0.8790
0.8980
0.9147
0.8599
0,8810
0.8997
0.8621
0.8830
0.90 15
0.9032
0.9192
0.9049
0.9207
0.9066
0,9222
0.9082
0.9236
0.9115
0.9265
1.3
0.9162
0.9306
0.9177
1.4
0.9292
0.9319
0.9370
0.9484
0.9582
0.9664
0.9732
0.9382
0.9495
0.9591
0.9671
0.9738
0.9394
0.9505
0.9599
0.9678
0.9744
0.9406
0.9515
0.9608
0.9686
0.9750
1.5
1.6
1.7
1.8
0.9332
0.9452
0.9554
0.9345
0.9463
0.9564
0.9357
0.9474
0.9573
0.9418
0.9525
0,9616
0.9429
0.9535
0.9625
0.9699
0.9761
0.9441
0.9545
0.9633
0.9641
0.9713
0.9656
0.9726
0.9693
0.9756
0.9706
0.9767
0.9649
1.9
0.9719
0.9772
0.9821
0.9861
0.9893
0.9918
0.9783
0.9830
0.9868
0.9788
0.9834
0.9871
0.9808
0.9850
2.0
2.1
2.2
2.3
0.9778
0.9826
0.9864
0.9896
0.9920
0.9793
0.9838
0.9875
0.9798
0.9842
0.9878
0,9906
0.9929
0.9803
0.9846
0.9881
0.9812
0.9854
0.9887
0.9913
0.9934
0.9817
0.9857
0.9884
0.9890
0.9898
0.9922
0.9901
0.9925
0.9904
0.9927
0.9909
0.9931
0.9911
0.9932
0.9916
0.9936
2.4
2.5
2.6
2.7
0.9938
0.9953
0.9965
0.9974
0.9981
0.9940
0.9955
0.9966
0.9941
0.9956
0.9967
0.9976
0.9982
0.9943
0.9957
0.9968
0.9977
0.9983
0.9945
0.9959
0.9969
0.9977
0.9984
0.9946
0.9960
0.9970
0.9978
0.9984
0.9948
0.9961
0.9971
0.9979
0.9985
0.9949
0.9962
0.9972
0.9979
0.9985
0.9951
0.9963
0.9973
0.9980
0.9952
0.9964
0.9974
0.9981
0.9986
2.8
2.9
0.9975
0.9982
0.9986
3.0
3.1
3.2
0,9987
0.9990
0.9993
0.9987
0.9991
0.9993
0.9995
0.9997
0.9987
0.9991
0.9994
0.9988
0.9991
0.9994
0.9988
0.9992
0.9994
0.9989
0.9992
0,9994
0.9989
0.9992
0.9994
0.9989
0.9992
0.9995
0.9996
0,9997
0.9990
0.9993
0.9995
0.9990
0.9993
0,9995
0,9997
0.9998
0.9995
0.9997
0.9995
0.9997
0.9996
0.9997
0.9996
0.9997
0.9996
0.9997
0.9996
0.9997
3.3
0.9996
3.4
0.9997
0.00
0.01
0.02
0.03
0.04
0.05
0.06
0.07
0.08
0.09
Print
Done
Expert Solution
This question has been solved!
Explore an expertly crafted, step-by-step solution for a thorough understanding of key concepts.

This is a popular solution!

Trending now
This is a popular solution!

Step by step
Solved in 2 steps

Knowledge Booster


Learn more about
Need a deep-dive on the concept behind this application? Look no further. Learn more about this topic, statistics and related others by exploring similar questions and additional content below.Recommended textbooks for you
MATLAB: An Introduction with Applications
Statistics
ISBN:
9781119256830
Author:
Amos Gilat
Publisher:
John Wiley & Sons Inc

Probability and Statistics for Engineering and th…
Statistics
ISBN:
9781305251809
Author:
Jay L. Devore
Publisher:
Cengage Learning

Statistics for The Behavioral Sciences (MindTap C…
Statistics
ISBN:
9781305504912
Author:
Frederick J Gravetter, Larry B. Wallnau
Publisher:
Cengage Learning
MATLAB: An Introduction with Applications
Statistics
ISBN:
9781119256830
Author:
Amos Gilat
Publisher:
John Wiley & Sons Inc
Probability and Statistics for Engineering and th…
Statistics
ISBN:
9781305251809
Author:
Jay L. Devore
Publisher:
Cengage Learning
Statistics for The Behavioral Sciences (MindTap C…
Statistics
ISBN:
9781305504912
Author:
Frederick J Gravetter, Larry B. Wallnau
Publisher:
Cengage Learning

Elementary Statistics: Picturing the World (7th E…
Statistics
ISBN:
9780134683416
Author:
Ron Larson, Betsy Farber
Publisher:
PEARSON

The Basic Practice of Statistics
Statistics
ISBN:
9781319042578
Author:
David S. Moore, William I. Notz, Michael A. Fligner
Publisher:
W. H. Freeman

Introduction to the Practice of Statistics
Statistics
ISBN:
9781319013387
Author:
David S. Moore, George P. McCabe, Bruce A. Craig
Publisher:
W. H. Freeman