The accompanying data represent the number of days absent, x, and the final exam score, y, for a sample of college students in a general education course at a large state university. Complete parts (a) through (e) below E Click the icon to view the absence count and final exam score data Click the icon to view a table of cntical values for the correlation coefficient - X he final exar (a) Find the least-squares Reference Absences and final exam scores (Round to three decimal Critical Values for Correlation Coefficient answer box (b) Interpret the slope an (Round to three decimal No. of 0 1 2 3 4 5 6 7 8 9. OA For every addition 3 0.997 k appropriate absences, x 4 0.950 Final 72.2 65.9 65.9 ferage final e exam score, y 88.4 86.7 83.6 80.2 78.3 73.5 64.7 OB. For every addition 0.878 OC. The average fina 0.811 erpret the s 6. OD. It is not appropria 7. 0.754 8. 0.707 Print Done (c) Predict the final exam 9. 0.666 y= (Round to two de 10 0.632 11 0.602 Compute the residual 12 0.576 Rt tn han derim 13 0.553 Statcrunch Next
The accompanying data represent the number of days absent, x, and the final exam score, y, for a sample of college students in a general education course at a large state university. Complete parts (a) through (e) below E Click the icon to view the absence count and final exam score data Click the icon to view a table of cntical values for the correlation coefficient - X he final exar (a) Find the least-squares Reference Absences and final exam scores (Round to three decimal Critical Values for Correlation Coefficient answer box (b) Interpret the slope an (Round to three decimal No. of 0 1 2 3 4 5 6 7 8 9. OA For every addition 3 0.997 k appropriate absences, x 4 0.950 Final 72.2 65.9 65.9 ferage final e exam score, y 88.4 86.7 83.6 80.2 78.3 73.5 64.7 OB. For every addition 0.878 OC. The average fina 0.811 erpret the s 6. OD. It is not appropria 7. 0.754 8. 0.707 Print Done (c) Predict the final exam 9. 0.666 y= (Round to two de 10 0.632 11 0.602 Compute the residual 12 0.576 Rt tn han derim 13 0.553 Statcrunch Next

Glencoe Algebra 1, Student Edition, 9780079039897, 0079039898, 2018
18th Edition
ISBN:9780079039897
Author:Carter
Publisher:Carter
Chapter10: Statistics
Section10.3: Measures Of Spread
Problem 1GP

Related questions
Question

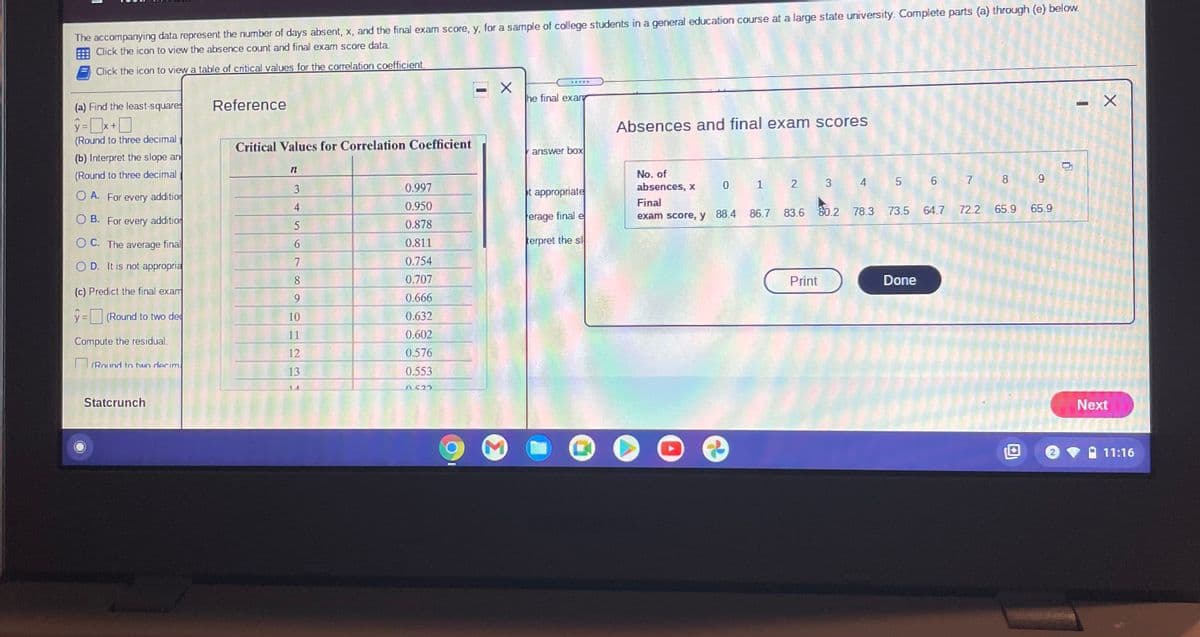
Transcribed Image Text:The accompanying data represent the number of days absent, x, and the final exam score, y, for a sample of college students in a general education course at a large state university. Complete parts (a) through (e) below
E Click the icon to view the absence count and final exam score data
Click the icon to view a table of critical values for the correlation coefficient.
(a) Find the leasi-squares regression line treating number of absences as the explanatory variable and the final exam score as the response variable.
(Round to three decimal places as needed.)
(b) Interpret the slope and the y-intercept, if appropriate. Choose the correct answer below and fill in any answer boxes in your choice.
(Round to three decimal places as needed.)
O A. For every additional absence, a student's final exam score drops
points, on average. It is not appropriate to interpret the y-intercept.
O B. For every additional absence, a student's final exam score drops
points, on average. The average final exam score of students who miss no classes is
It is not appropriate to interpret the slope.
OL The average final exam score of students who miss no classes is
O D. It is not appropriate to interpret the slope or the y-intercept.
(c) Predict the final exam score for a student who misses five class periods.
y = (Round to two decimal places as needed.)
Compute the residual.
ITRound to twn decimal nlaces as needed )
Statcrunch
Next
A 11:16
esc
%23
&
4
9.
backspace
e
y
*00
口 85
Transcribed Image Text:The accompanying data represent the number of days absent, x, and the final exam score, y, for a sample of college students in a general education course at a large state university. Complete parts (a) through (e) below.
Click the icon to view the absence count and final exam score data
Click the icon to view a table of critical values for the correlation coefficient.
.....
he final exar
(a) Find the least-squares
Reference
Absences and final exam scores
(Round to three decimal
Critical Values for Correlation Coefficient
answer box
(b) Interpret the slope an
(Round to three decimal
No. of
9.
absences, x
0 1 2 3 4 5 6 7
3
0.997
t appropriate
O A. For every addition
0.950
Final
86.7
83.6
80.2 78.3 73.5 64.7 72.2 65.9 65.9
O B. For every addition
erage final e
exam score, y 88.4
5
0.878
O C. The average final
0.811
terpret the sl
0.754
O D. It is not appropria
8
0.707
Print
Done
(c) Predict the final exam
6.
0.666
y =(Round to two de
10
0.632
11
0.602
Compute the residual.
12
0.576
(Round to hwn decim
13
0.553
14
Statcrunch
Next
11:16
曲
Expert Solution
This question has been solved!
Explore an expertly crafted, step-by-step solution for a thorough understanding of key concepts.

This is a popular solution!

Trending now
This is a popular solution!

Step by step
Solved in 3 steps with 3 images

Recommended textbooks for you
Glencoe Algebra 1, Student Edition, 9780079039897…
Algebra
ISBN:
9780079039897
Author:
Carter
Publisher:
McGraw Hill

Big Ideas Math A Bridge To Success Algebra 1: Stu…
Algebra
ISBN:
9781680331141
Author:
HOUGHTON MIFFLIN HARCOURT
Publisher:
Houghton Mifflin Harcourt
Glencoe Algebra 1, Student Edition, 9780079039897…
Algebra
ISBN:
9780079039897
Author:
Carter
Publisher:
McGraw Hill
Big Ideas Math A Bridge To Success Algebra 1: Stu…
Algebra
ISBN:
9781680331141
Author:
HOUGHTON MIFFLIN HARCOURT
Publisher:
Houghton Mifflin Harcourt