For the table of data find the following a. Draw a scatterplot b. Caleulate the correlation coefficient c. Calculate the least squares line and graph it on the scalterplot. d. Predict the y value when x is 11. x1 2 3 456 7 8 9 10 2 y0.3 08 1.3 2.3 31 33 33 43 48 53 a. Choose the correct scatterplot below
For the table of data find the following a. Draw a scatterplot b. Caleulate the correlation coefficient c. Calculate the least squares line and graph it on the scalterplot. d. Predict the y value when x is 11. x1 2 3 456 7 8 9 10 2 y0.3 08 1.3 2.3 31 33 33 43 48 53 a. Choose the correct scatterplot below

Linear Algebra: A Modern Introduction
4th Edition
ISBN:9781285463247
Author:David Poole
Publisher:David Poole
Chapter7: Distance And Approximation
Section7.3: Least Squares Approximation
Problem 31EQ

Related questions
Question
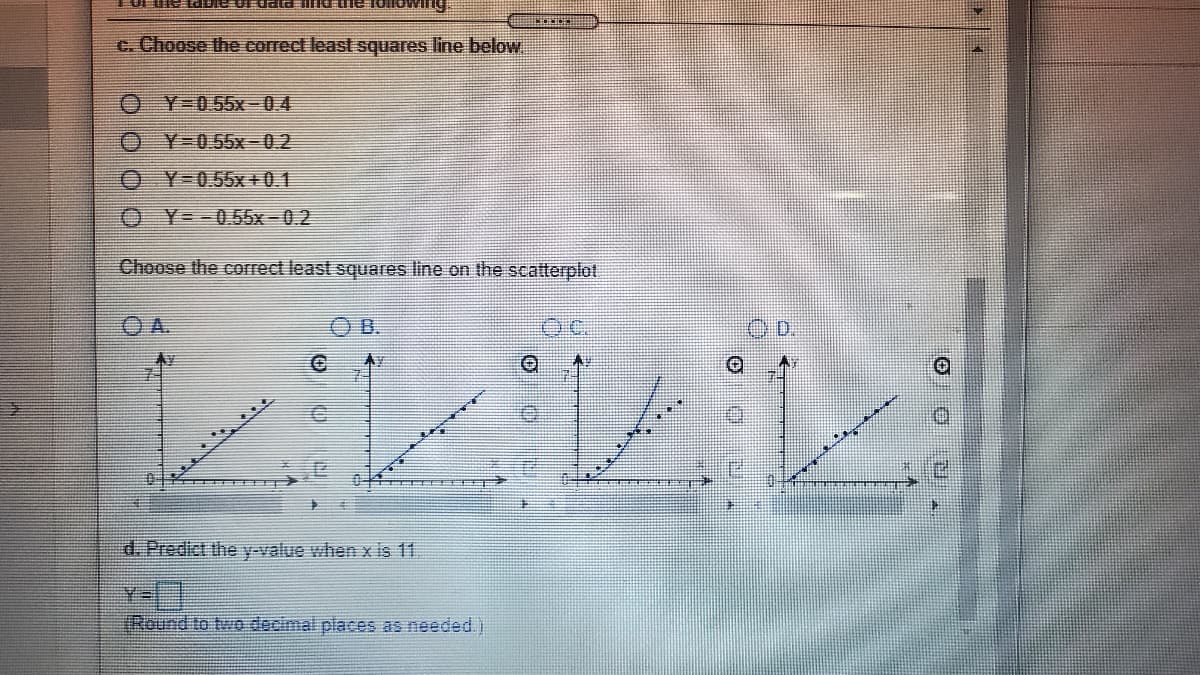
Transcribed Image Text:c. Choose the correct least squares line below
O Y-055x-04
Y-0.55x-0.2
O Y-0.55x +0.1
O Y=-0.55x-0.2
Choose the correct least squares line on the scatterplot
O B.
d. Predict the y-value when x is 11.
IRound to two decimal places as needed.)
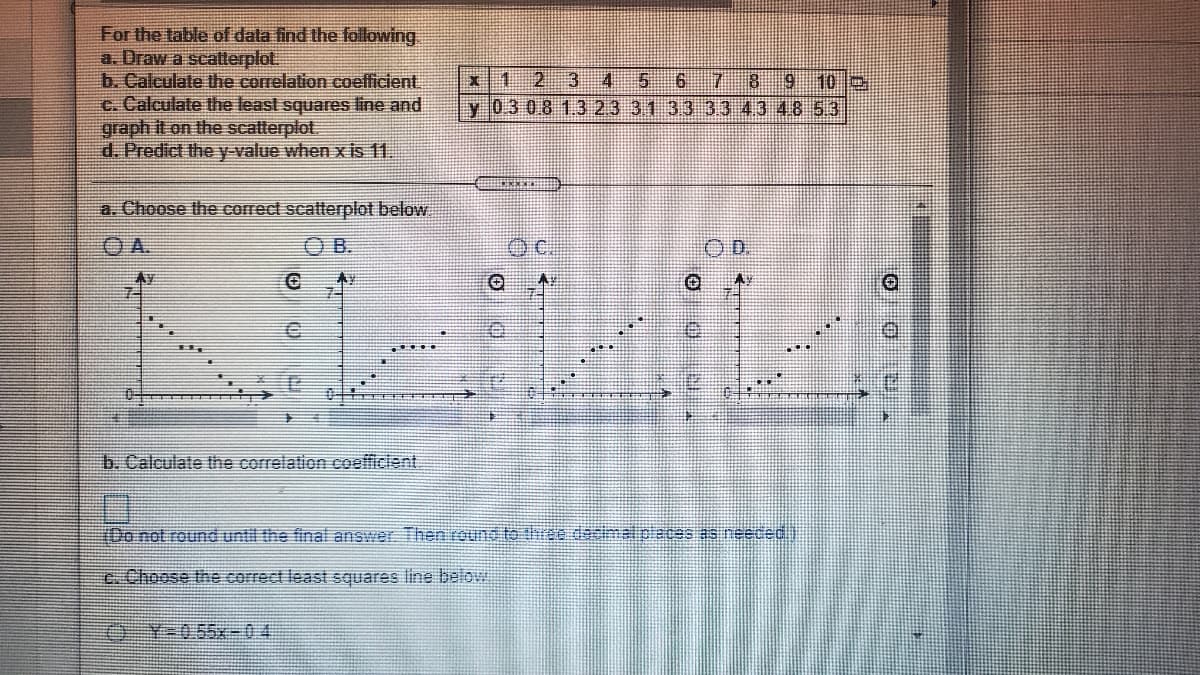
Transcribed Image Text:For the table of data find the following.
a. Draw a scatterplot.
b. Caleulate the correlation coefficient
c. Calculate the least squares line and
graph it on the scatterplot.
d. Predict the y value when x is 11.
1 23
8 9 10
4
y 03 0.8 1323 3133 33 4.3 4853
5.
a. Choose the correct scatterplot below
OA.
OB.
OC.
Ay
b. Calculate the correlation coefficient
(Donot round until the final answer Then round to three dasimal pleces as neeced
e. Choose the correct least squares line belowi
¥*0,55x-04
Expert Solution
This question has been solved!
Explore an expertly crafted, step-by-step solution for a thorough understanding of key concepts.

This is a popular solution!

Trending now
This is a popular solution!

Step by step
Solved in 4 steps with 4 images

Recommended textbooks for you
Linear Algebra: A Modern Introduction
Algebra
ISBN:
9781285463247
Author:
David Poole
Publisher:
Cengage Learning

Functions and Change: A Modeling Approach to Coll…
Algebra
ISBN:
9781337111348
Author:
Bruce Crauder, Benny Evans, Alan Noell
Publisher:
Cengage Learning
Linear Algebra: A Modern Introduction
Algebra
ISBN:
9781285463247
Author:
David Poole
Publisher:
Cengage Learning
Functions and Change: A Modeling Approach to Coll…
Algebra
ISBN:
9781337111348
Author:
Bruce Crauder, Benny Evans, Alan Noell
Publisher:
Cengage Learning