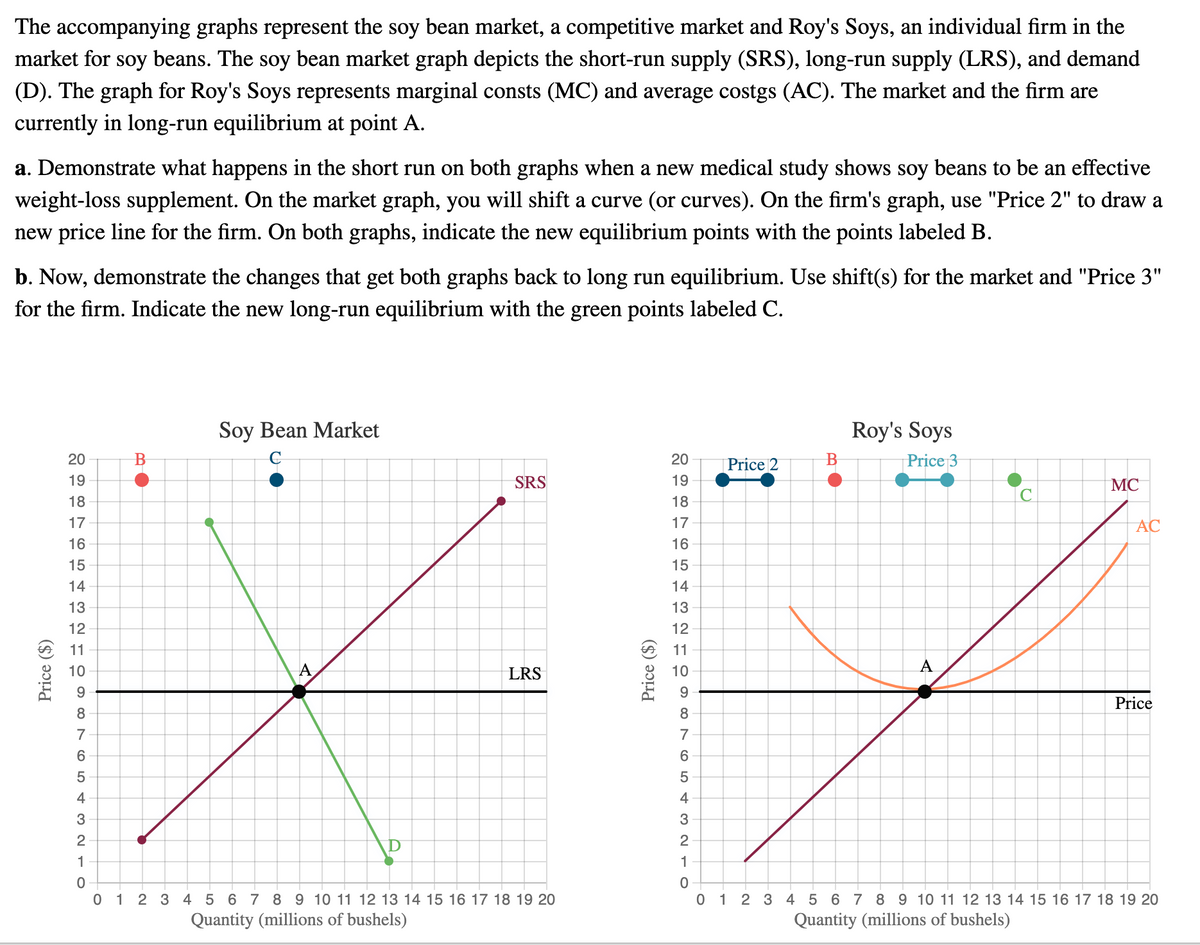
The accompanying graphs represent the soy bean market, a competitive market and Roy's Soys, an individual firm in the market for soy beans. The soy bean market graph depicts the short-run supply (SRS), long-run supply (LRS), and demand (D). The graph for Roy's Soys represents marginal consts (MC) and average costgs (AC). The market and the firm are currently in long-run equilibrium at point A. a. Demonstrate what happens in the short run on both graphs when a new medical study shows soy beans to be an effective weight-loss supplement. On the market graph, you will shift a curve (or curves). On the firm's graph, use "Price 2" to draw a new price line for the firm. On both graphs, indicate the new equilibrium points with the points labeled B. b. Now, demonstrate the changes that get both graphs back to long run equilibrium. Use shift(s) for the market and "Price 3" for the firm. Indicate the new long-run equilibrium with the green points labeled C.
The accompanying graphs represent the soy bean market, a competitive market and Roy's Soys, an individual firm in the market for soy beans. The soy bean market graph depicts the short-run supply (SRS), long-run supply (LRS), and demand (D). The graph for Roy's Soys represents marginal consts (MC) and average costgs (AC). The market and the firm are currently in long-run equilibrium at point A. a. Demonstrate what happens in the short run on both graphs when a new medical study shows soy beans to be an effective weight-loss supplement. On the market graph, you will shift a curve (or curves). On the firm's graph, use "Price 2" to draw a new price line for the firm. On both graphs, indicate the new equilibrium points with the points labeled B. b. Now, demonstrate the changes that get both graphs back to long run equilibrium. Use shift(s) for the market and "Price 3" for the firm. Indicate the new long-run equilibrium with the green points labeled C.

Principles of Microeconomics
7th Edition
ISBN:9781305156050
Author:N. Gregory Mankiw
Publisher:N. Gregory Mankiw
Chapter14: Firms In Competitive Markets
Section: Chapter Questions
Problem 10PA

Related questions
Question
Transcribed Image Text:The
accompanying graphs represent the soy bean market, a competitive market and Roy's Soys, an individual firm in the
market for
soy
beans. The
soy
bean market graph depicts the short-run supply (SRS), long-run supply (LRS), and demand
(D). The graph for Roy's Soys represents marginal consts (MC) and average costgs (AC). The market and the firm are
currently in long-run equilibrium at point A.
a. Demonstrate what happens in the short run on both graphs when a new medical study shows soy beans to be an effective
weight-loss supplement. On the market graph, you will shift a curve (or curves). On the firm's graph, use "Price 2" to draw a
new price line for the firm. On both graphs, indicate the new equilibrium points with the points labeled B.
b. Now, demonstrate the changes that get both graphs back to long run equilibrium. Use shift(s) for the market and "Price 3"
for the firm. Indicate the new long-run equilibrium with the green points labeled C.
Soy Bean Market
Roy's Soys
20
20
Price 2
Price 3
19
SRS
19
MC
18
18
17
17
AC
16
16
15
15
14
14
13
13
12
12
11
11
10
A
LRS
10
A
9.
9.
Price
8
7
7
4
4
3
3
2
1
1
0 1 2 3 4 5 6 7 8 9 10 11 12 13 14 15 16 17 18 19 20
Quantity (millions of bushels)
0 1 2 3 4 5 6 7 8 9 10 11 12 13 14 15 16 17 18 19 20
Quantity (millions of bushels)
Price ($)
Price ($)
Expert Solution
This question has been solved!
Explore an expertly crafted, step-by-step solution for a thorough understanding of key concepts.

This is a popular solution!

Trending now
This is a popular solution!

Step by step
Solved in 3 steps with 1 images

Knowledge Booster


Learn more about
Need a deep-dive on the concept behind this application? Look no further. Learn more about this topic, economics and related others by exploring similar questions and additional content below.Recommended textbooks for you
Principles of Microeconomics
Economics
ISBN:
9781305156050
Author:
N. Gregory Mankiw
Publisher:
Cengage Learning

Principles of Economics (MindTap Course List)
Economics
ISBN:
9781305585126
Author:
N. Gregory Mankiw
Publisher:
Cengage Learning

Essentials of Economics (MindTap Course List)
Economics
ISBN:
9781337091992
Author:
N. Gregory Mankiw
Publisher:
Cengage Learning
Principles of Microeconomics
Economics
ISBN:
9781305156050
Author:
N. Gregory Mankiw
Publisher:
Cengage Learning
Principles of Economics (MindTap Course List)
Economics
ISBN:
9781305585126
Author:
N. Gregory Mankiw
Publisher:
Cengage Learning
Essentials of Economics (MindTap Course List)
Economics
ISBN:
9781337091992
Author:
N. Gregory Mankiw
Publisher:
Cengage Learning

Principles of Economics, 7th Edition (MindTap Cou…
Economics
ISBN:
9781285165875
Author:
N. Gregory Mankiw
Publisher:
Cengage Learning

Principles of Microeconomics (MindTap Course List)
Economics
ISBN:
9781305971493
Author:
N. Gregory Mankiw
Publisher:
Cengage Learning
