The accompanying graphs represent the soy bean market, a competitive market and Roy's Soys, an individual firm in the market for soy beans. The soy bean market graph depicts the short-run supply (SRS), long-run supply (LRS), and demand (D). The graph for Roy's Soys represents marginal consts (MC) and average costgs (AC). The market and the firm are currently in long-run equilibrium at point A. a. Demonstrate what happens in the short run on both graphs when a new medical study shows soy beans to be an effective weight-loss supplement. On the market graph, you will shift a curve (or curves). On the firm's graph, use "Price 2" to draw a new price line for the firm. On both graphs, indicate the new equilibrium points with the points labeled B. b. Now, demonstrate the changes that get both graphs back to long run equilibrium. Use shift(s) for the market and "Price 3" for the firm. Indicate the new long-run equilibrium with the green points labeled C. Soy Bean Market Roy's Soys Price 3 20 20 Price 2 19 SRS 19 MC C. 18 18 17 17 AC 16 16 15 15 14 14 13 13 12 12 11 11 10 10 LRS Price 4 4 0 1 2 3 4 5 67 8 9 10 11 12 13 14 15 16 17 18 19 20 Quantity (millions of bushels) 0 1 2 3 4 5 67 8 9 10 11 12 13 14 15 16 17 18 19 20 Quantity (millions of bushels) Price (S) Price (S)
The accompanying graphs represent the soy bean market, a competitive market and Roy's Soys, an individual firm in the market for soy beans. The soy bean market graph depicts the short-run supply (SRS), long-run supply (LRS), and demand (D). The graph for Roy's Soys represents marginal consts (MC) and average costgs (AC). The market and the firm are currently in long-run equilibrium at point A. a. Demonstrate what happens in the short run on both graphs when a new medical study shows soy beans to be an effective weight-loss supplement. On the market graph, you will shift a curve (or curves). On the firm's graph, use "Price 2" to draw a new price line for the firm. On both graphs, indicate the new equilibrium points with the points labeled B. b. Now, demonstrate the changes that get both graphs back to long run equilibrium. Use shift(s) for the market and "Price 3" for the firm. Indicate the new long-run equilibrium with the green points labeled C. Soy Bean Market Roy's Soys Price 3 20 20 Price 2 19 SRS 19 MC C. 18 18 17 17 AC 16 16 15 15 14 14 13 13 12 12 11 11 10 10 LRS Price 4 4 0 1 2 3 4 5 67 8 9 10 11 12 13 14 15 16 17 18 19 20 Quantity (millions of bushels) 0 1 2 3 4 5 67 8 9 10 11 12 13 14 15 16 17 18 19 20 Quantity (millions of bushels) Price (S) Price (S)

Microeconomics: Private and Public Choice (MindTap Course List)
16th Edition
ISBN:9781305506893
Author:James D. Gwartney, Richard L. Stroup, Russell S. Sobel, David A. Macpherson
Publisher:James D. Gwartney, Richard L. Stroup, Russell S. Sobel, David A. Macpherson
Chapter9: Price Takers And The Competitive Process
Section: Chapter Questions
Problem 16CQ

Related questions
Question
100%
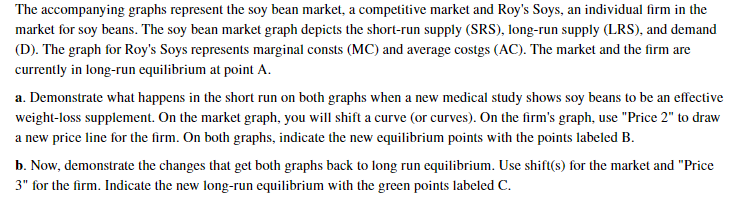
Transcribed Image Text:The accompanying graphs represent the soy bean market, a competitive market and Roy's Soys, an individual firm in the
market for soy beans. The soy bean market graph depicts the short-run supply (SRS), long-run supply (LRS), and demand
(D). The graph for Roy's Soys represents marginal consts (MC) and average costgs (AC). The market and the firm are
currently in long-run equilibrium at point A.
a. Demonstrate what happens in the short run on both graphs when a new medical study shows soy beans to be an effective
weight-loss supplement. On the market graph, you will shift a curve (or curves). On the firm's graph, use "Price 2" to draw
a new price line for the firm. On both graphs, indicate the new equilibrium points with the points labeled B.
b. Now, demonstrate the changes that get both graphs back to long run equilibrium. Use shift(s) for the market and "Price
3" for the firm. Indicate the new long-run equilibrium with the green points labeled C.
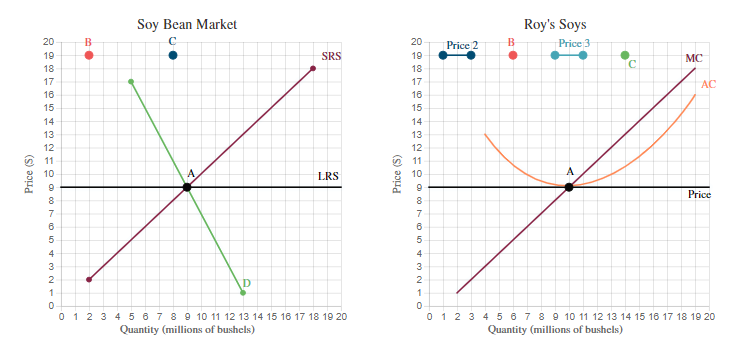
Transcribed Image Text:Soy Bean Market
Roy's Soys
Price 3
20
20
Price 2
19
SRS
19
MC
C.
18
18
17
17
AC
16
16
15
15
14
14
13
13
12
12
11
11
10
10
LRS
Price
4
4
0 1 2 3
4 5 67 8 9 10 11 12 13 14 15 16 17 18 19 20
Quantity (millions of bushels)
0 1 2 3 4 5 67 8 9 10 11 12 13 14 15 16 17 18 19 20
Quantity (millions of bushels)
Price (S)
Price (S)
Expert Solution
This question has been solved!
Explore an expertly crafted, step-by-step solution for a thorough understanding of key concepts.

This is a popular solution!

Trending now
This is a popular solution!

Step by step
Solved in 3 steps with 1 images

Recommended textbooks for you
Microeconomics: Private and Public Choice (MindTa…
Economics
ISBN:
9781305506893
Author:
James D. Gwartney, Richard L. Stroup, Russell S. Sobel, David A. Macpherson
Publisher:
Cengage Learning

Economics: Private and Public Choice (MindTap Cou…
Economics
ISBN:
9781305506725
Author:
James D. Gwartney, Richard L. Stroup, Russell S. Sobel, David A. Macpherson
Publisher:
Cengage Learning

Microeconomics: Private and Public Choice (MindTa…
Economics
ISBN:
9781305506893
Author:
James D. Gwartney, Richard L. Stroup, Russell S. Sobel, David A. Macpherson
Publisher:
Cengage Learning
Economics: Private and Public Choice (MindTap Cou…
Economics
ISBN:
9781305506725
Author:
James D. Gwartney, Richard L. Stroup, Russell S. Sobel, David A. Macpherson
Publisher:
Cengage Learning

Exploring Economics
Economics
ISBN:
9781544336329
Author:
Robert L. Sexton
Publisher:
SAGE Publications, Inc
