The accompanying table contains the willingness to pay for 5 students in the market for a new tablet. Identify which portion of the demand curve below represents each individual Student Willingness to Pay Francisco $200 A 500 $300 Lily Amanda $400 B 400 $100 Julio Anthony $500 C 300 D 200 E 100 2 0 3 Quantity of students Price (in dollars Quantity of students Francisco is Lily is Amanda is Julio is Anthony is Which students will purchase a tablet if the price of a tablet is $550? everyone no one Lily, Amanda, and Anthony O Anthony
The accompanying table contains the willingness to pay for 5 students in the market for a new tablet. Identify which portion of the demand curve below represents each individual Student Willingness to Pay Francisco $200 A 500 $300 Lily Amanda $400 B 400 $100 Julio Anthony $500 C 300 D 200 E 100 2 0 3 Quantity of students Price (in dollars Quantity of students Francisco is Lily is Amanda is Julio is Anthony is Which students will purchase a tablet if the price of a tablet is $550? everyone no one Lily, Amanda, and Anthony O Anthony

Chapter7: Market Efficiency And Welfare
Section: Chapter Questions
Problem 2P

Related questions
Question
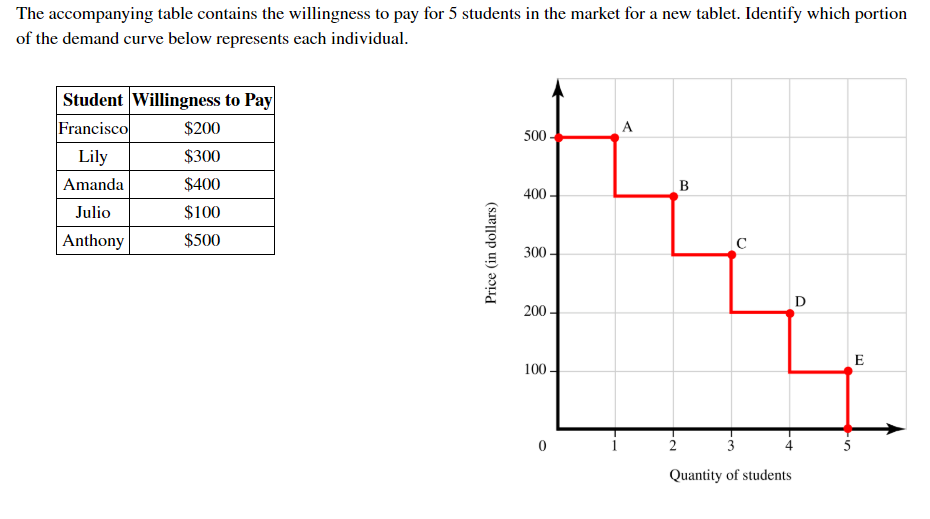
Transcribed Image Text:The accompanying table contains the willingness to pay for 5 students in the market for a new tablet. Identify which portion
of the demand curve below represents each individual
Student Willingness to Pay
Francisco
$200
A
500
$300
Lily
Amanda
$400
B
400
$100
Julio
Anthony
$500
C
300
D
200
E
100
2
0
3
Quantity of students
Price (in dollars
Transcribed Image Text:Quantity of students
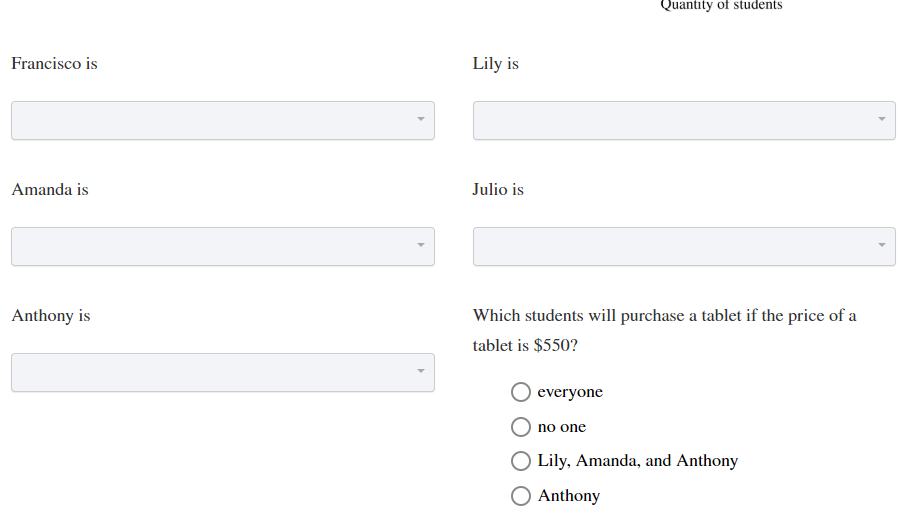
Francisco is
Lily is
Amanda is
Julio is
Anthony is
Which students will purchase a tablet if the price of
a
tablet is $550?
everyone
no one
Lily, Amanda, and Anthony
O Anthony
Expert Solution
This question has been solved!
Explore an expertly crafted, step-by-step solution for a thorough understanding of key concepts.

This is a popular solution!

Trending now
This is a popular solution!

Step by step
Solved in 2 steps

Recommended textbooks for you
Exploring Economics
Economics
ISBN:
9781544336329
Author:
Robert L. Sexton
Publisher:
SAGE Publications, Inc

Principles of Economics 2e
Economics
ISBN:
9781947172364
Author:
Steven A. Greenlaw; David Shapiro
Publisher:
OpenStax

Essentials of Economics (MindTap Course List)
Economics
ISBN:
9781337091992
Author:
N. Gregory Mankiw
Publisher:
Cengage Learning
Exploring Economics
Economics
ISBN:
9781544336329
Author:
Robert L. Sexton
Publisher:
SAGE Publications, Inc
Principles of Economics 2e
Economics
ISBN:
9781947172364
Author:
Steven A. Greenlaw; David Shapiro
Publisher:
OpenStax
Essentials of Economics (MindTap Course List)
Economics
ISBN:
9781337091992
Author:
N. Gregory Mankiw
Publisher:
Cengage Learning