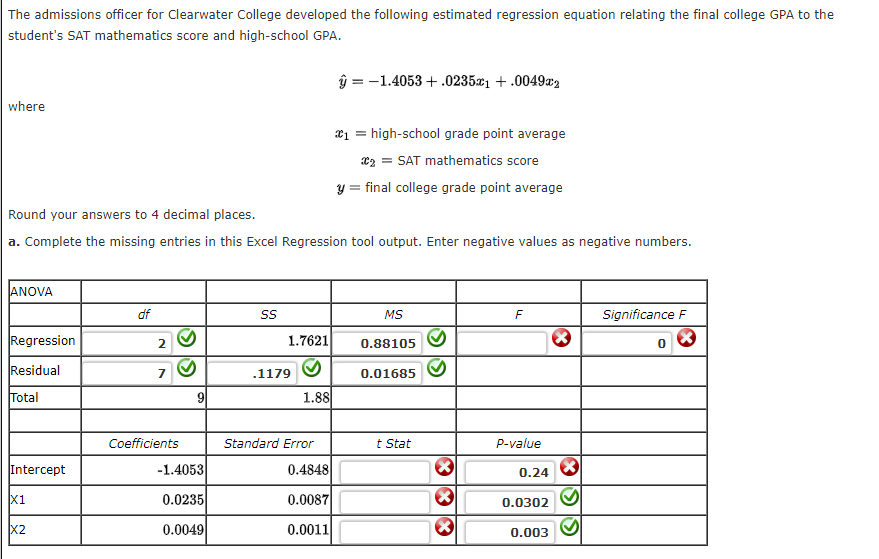
The admissions officer for Clearwater College developed the following estimated regression equation relating the final college GPA to the student's SAT mathematics score and high-school GPA. ŷ = -1.4053 + .0235x1 + .0049x2 where ¤1 = high-school grade point average xz = SAT mathematics score y = final college grade point average Round your answers to 4 decimal places. a. Complete the missing entries in this Excel Regression tool output. Enter negative values as negative numbers.


Angles in Circles
Angles within a circle are feasible to create with the help of different properties of the circle such as radii, tangents, and chords. The radius is the distance from the center of the circle to the circumference of the circle. A tangent is a line made perpendicular to the radius through its endpoint placed on the circle as well as the line drawn at right angles to a tangent across the point of contact when the circle passes through the center of the circle. The chord is a line segment with its endpoints on the circle. A secant line or secant is the infinite extension of the chord.
Arcs in Circles
A circular arc is the arc of a circle formed by two distinct points. It is a section or segment of the circumference of a circle. A straight line passing through the center connecting the two distinct ends of the arc is termed a semi-circular arc.
I need help with the red X's


Trending now
This is a popular solution!

Step by step
Solved in 4 steps


