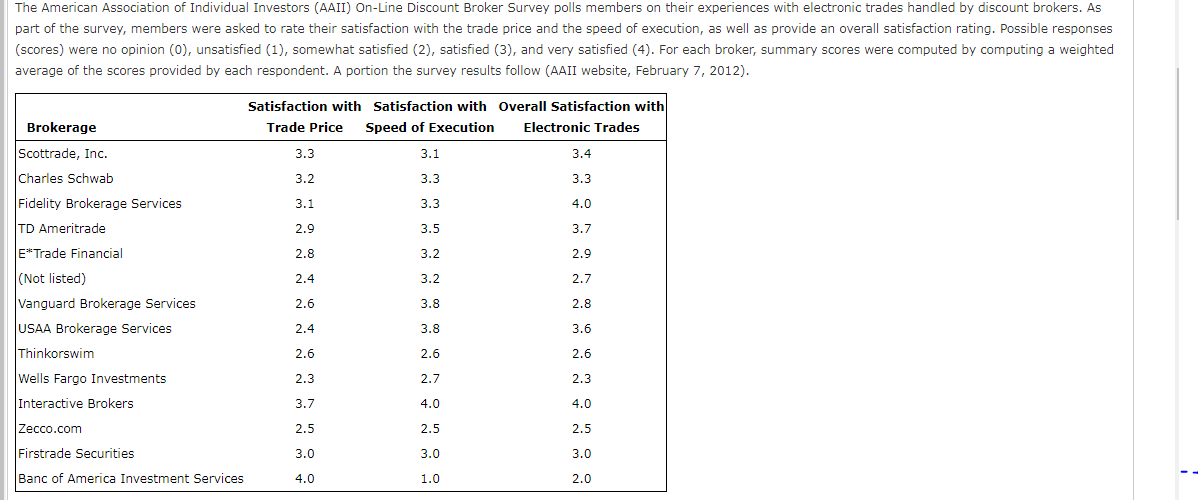
The American Association of Individual Investors (AAII) On-Line Discount Broker Survey polls members on their experiences with electronic trades handled by discount brokers. As part of the survey, members were asked to rate their satisfaction with the trade price and the speed of execution, as well as provide an overall satisfaction rating. Possible responses (scores) were no opinion (0), unsatisfied (1), somewhat satisfied (2), satisfied (3), and very satisfied (4). For each broker, summary scores were computed by computing a weighted average of the scores provided by each respondent. A portion the survey results follow (AAII website, February 7, 2012). Satisfaction with Satisfaction with Overall Satisfaction with Brokerage Trade Price Speed of Execution Electronic Trades
The American Association of Individual Investors (AAII) On-Line Discount Broker Survey polls members on their experiences with electronic trades handled by discount brokers. As part of the survey, members were asked to rate their satisfaction with the trade price and the speed of execution, as well as provide an overall satisfaction rating. Possible responses (scores) were no opinion (0), unsatisfied (1), somewhat satisfied (2), satisfied (3), and very satisfied (4). For each broker, summary scores were computed by computing a weighted average of the scores provided by each respondent. A portion the survey results follow (AAII website, February 7, 2012). Satisfaction with Satisfaction with Overall Satisfaction with Brokerage Trade Price Speed of Execution Electronic Trades

Glencoe Algebra 1, Student Edition, 9780079039897, 0079039898, 2018
18th Edition
ISBN:9780079039897
Author:Carter
Publisher:Carter
Chapter10: Statistics
Section10.6: Summarizing Categorical Data
Problem 30PPS

Related questions
Question
100%
Transcribed Image Text:The American Association of Individual Investors (AAII) On-Line Discount Broker Survey polls members on their experiences with electronic trades handled by discount brokers. As
part of the survey, members were asked to rate their satisfaction with the trade price and the speed of execution, as well as provide an overall satisfaction rating. Possible responses
(scores) were no opinion (0), unsatisfied (1), somewhat satisfied (2), satisfied (3), and very satisfied (4). For each broker, summary scores were computed by computing a weighted
average of the scores provided by each respondent. A portion the survey results follow (AAII website, February 7, 2012).
Satisfaction with Satisfaction with Overall Satisfaction with
Brokerage
Trade Price
Speed of Execution
Electronic Trades
Scottrade, Inc.
Charles Schwab
3.3
3.1
3.4
3.2
3.3
3.3
Fidelity Brokerage Services
3.1
3.3
4.0
TD Ameritrade
2.9
3.5
3.7
E*Trade Financial
2.8
3.2
2.9
(Not listed)
2.4
3.2
2.7
Vanguard Brokerage Services
2.6
3.8
2.8
USAA Brokerage Services
2.4
3.8
3.6
Thinkorswim
2.6
2.6
2.6
Wells Fargo Investments
2.3
2.7
2.3
Interactive Brokers
3.7
4.0
4.0
|Zecco.com
2.5
2.5
2.5
Firstrade Securities
3.0
3.0
3.0
Banc of America Investment Services
4.0
1.0
2.0
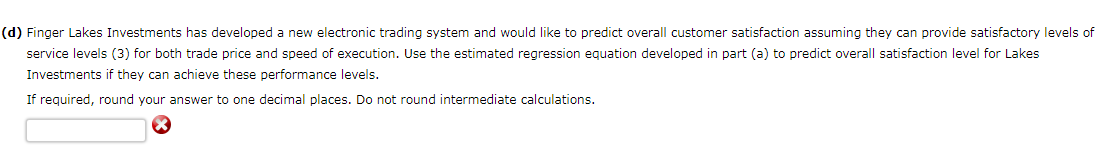
Transcribed Image Text:(d) Finger Lakes Investments has developed a new electronic trading system and would like to predict overall customer satisfaction assuming they can provide satisfactory levels of
service levels (3) for both trade price and speed of execution. Use the estimated regression equation developed in part (a) to predict overall satisfaction level for Lakes
Investments if they can achieve these performance levels.
If required, round your answer to one decimal places. Do not round intermediate calculations.
Expert Solution
This question has been solved!
Explore an expertly crafted, step-by-step solution for a thorough understanding of key concepts.

This is a popular solution!

Trending now
This is a popular solution!

Step by step
Solved in 3 steps with 1 images

Recommended textbooks for you
Glencoe Algebra 1, Student Edition, 9780079039897…
Algebra
ISBN:
9780079039897
Author:
Carter
Publisher:
McGraw Hill


Holt Mcdougal Larson Pre-algebra: Student Edition…
Algebra
ISBN:
9780547587776
Author:
HOLT MCDOUGAL
Publisher:
HOLT MCDOUGAL
Glencoe Algebra 1, Student Edition, 9780079039897…
Algebra
ISBN:
9780079039897
Author:
Carter
Publisher:
McGraw Hill
Holt Mcdougal Larson Pre-algebra: Student Edition…
Algebra
ISBN:
9780547587776
Author:
HOLT MCDOUGAL
Publisher:
HOLT MCDOUGAL