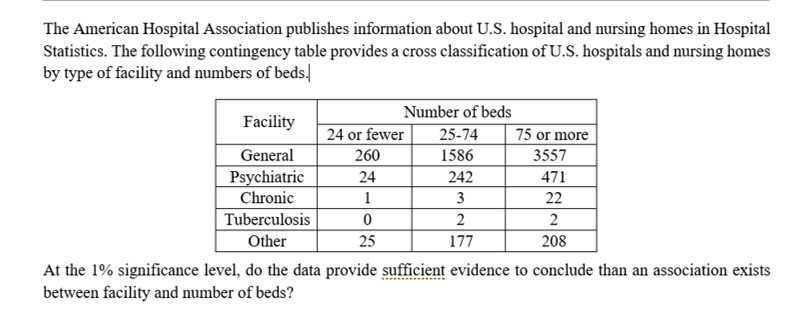
The American Hospital Association publishes information about U.S. hospital and nursing homes in Hospital Statistics. The following contingency table provides a cross classification of U.S. hospitals and nursing homes by type of facility and numbers of beds. Number of beds Facility 24 or fewer 25-74 75 or more General 260 1586 3557 Psychiatric Chronic 24 242 471 1 3 22 Tuberculosis 2 2 Other 25 177 208 At the 1% significance level, do the data provide sufficient evidence to conclude than an association exists between facility and number of beds?
The American Hospital Association publishes information about U.S. hospital and nursing homes in Hospital Statistics. The following contingency table provides a cross classification of U.S. hospitals and nursing homes by type of facility and numbers of beds. Number of beds Facility 24 or fewer 25-74 75 or more General 260 1586 3557 Psychiatric Chronic 24 242 471 1 3 22 Tuberculosis 2 2 Other 25 177 208 At the 1% significance level, do the data provide sufficient evidence to conclude than an association exists between facility and number of beds?

MATLAB: An Introduction with Applications
6th Edition
ISBN:9781119256830
Author:Amos Gilat
Publisher:Amos Gilat
Chapter1: Starting With Matlab
Section: Chapter Questions
Problem 1P

Related questions
Question
Transcribed Image Text:The American Hospital Association publishes information about U.S. hospital and nursing homes in Hospital
Statistics. The following contingency table provides a cross classification of U.S. hospitals and nursing homes
by type of facility and numbers of beds.
Number of beds
Facility
24 or fewer
25-74
75 or more
General
260
1586
3557
Psychiatric
Chronic
24
242
471
1
3
22
Tuberculosis
2
2
Other
25
177
208
At the 1% significance level, do the data provide sufficient evidence to conclude than an association exists
between facility and number of beds?
Expert Solution
This question has been solved!
Explore an expertly crafted, step-by-step solution for a thorough understanding of key concepts.

This is a popular solution!

Trending now
This is a popular solution!

Step by step
Solved in 5 steps with 4 images

Knowledge Booster


Learn more about
Need a deep-dive on the concept behind this application? Look no further. Learn more about this topic, statistics and related others by exploring similar questions and additional content below.Recommended textbooks for you
MATLAB: An Introduction with Applications
Statistics
ISBN:
9781119256830
Author:
Amos Gilat
Publisher:
John Wiley & Sons Inc

Probability and Statistics for Engineering and th…
Statistics
ISBN:
9781305251809
Author:
Jay L. Devore
Publisher:
Cengage Learning

Statistics for The Behavioral Sciences (MindTap C…
Statistics
ISBN:
9781305504912
Author:
Frederick J Gravetter, Larry B. Wallnau
Publisher:
Cengage Learning
MATLAB: An Introduction with Applications
Statistics
ISBN:
9781119256830
Author:
Amos Gilat
Publisher:
John Wiley & Sons Inc
Probability and Statistics for Engineering and th…
Statistics
ISBN:
9781305251809
Author:
Jay L. Devore
Publisher:
Cengage Learning
Statistics for The Behavioral Sciences (MindTap C…
Statistics
ISBN:
9781305504912
Author:
Frederick J Gravetter, Larry B. Wallnau
Publisher:
Cengage Learning

Elementary Statistics: Picturing the World (7th E…
Statistics
ISBN:
9780134683416
Author:
Ron Larson, Betsy Farber
Publisher:
PEARSON

The Basic Practice of Statistics
Statistics
ISBN:
9781319042578
Author:
David S. Moore, William I. Notz, Michael A. Fligner
Publisher:
W. H. Freeman

Introduction to the Practice of Statistics
Statistics
ISBN:
9781319013387
Author:
David S. Moore, George P. McCabe, Bruce A. Craig
Publisher:
W. H. Freeman