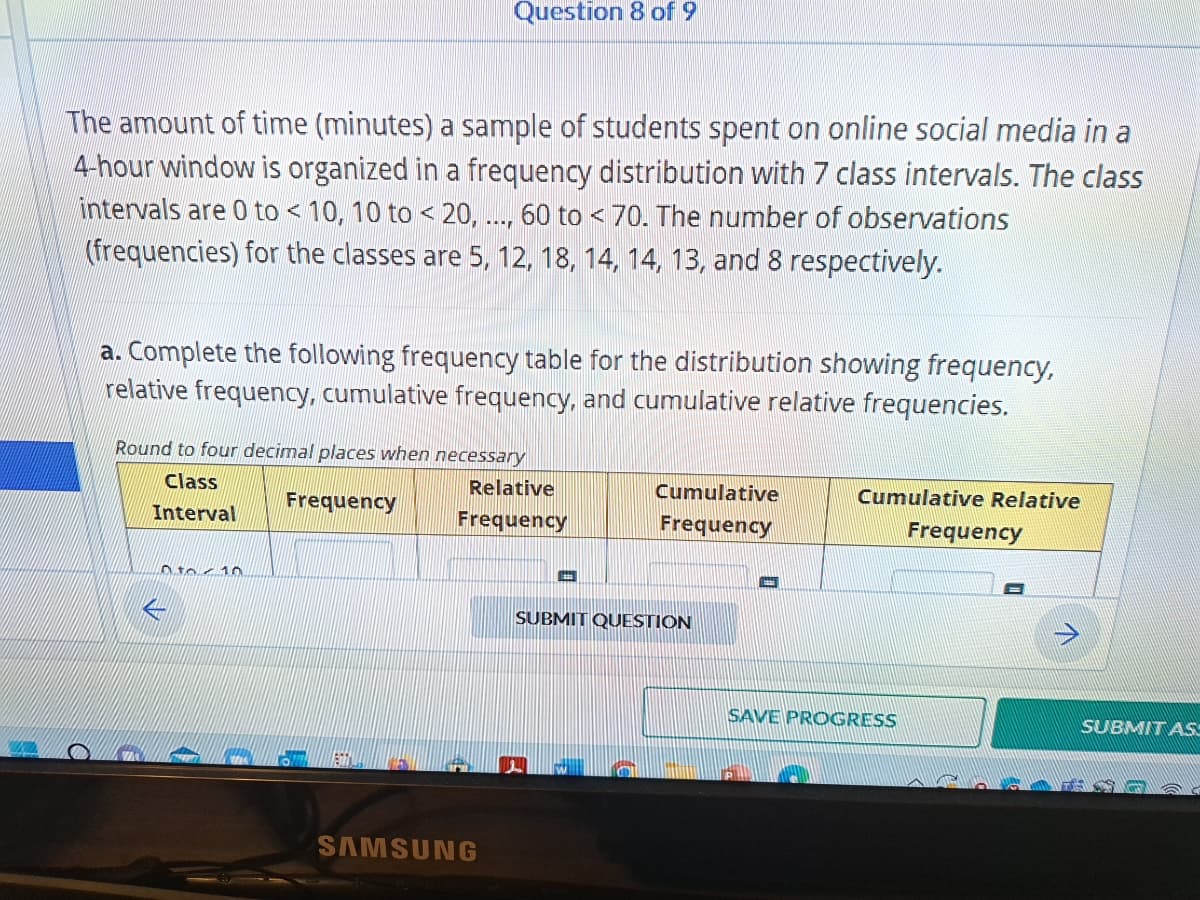
The amount of time (minutes) a sample of students spent on online social media in a 4-hour window is organized in a frequency distribution with 7 class intervals. The class intervals are 0 to < 10, 10 to < 20, ..., 60 to < 70. The number of observations (frequencies) for the classes are 5, 12, 18, 14, 14, 13, and 8 respectively. a. Complete the following frequency table for the distribution showing frequency, relative frequency, cumulative frequency, and cumulative relative frequencies.
The amount of time (minutes) a sample of students spent on online social media in a 4-hour window is organized in a frequency distribution with 7 class intervals. The class intervals are 0 to < 10, 10 to < 20, ..., 60 to < 70. The number of observations (frequencies) for the classes are 5, 12, 18, 14, 14, 13, and 8 respectively. a. Complete the following frequency table for the distribution showing frequency, relative frequency, cumulative frequency, and cumulative relative frequencies.

Algebra & Trigonometry with Analytic Geometry
13th Edition
ISBN:9781133382119
Author:Swokowski
Publisher:Swokowski
Chapter10: Sequences, Series, And Probability
Section10.8: Probability
Problem 32E

Related questions
Question
Transcribed Image Text:The amount of time (minutes) a sample of students spent on online social media in a
4-hour window is organized in a frequency distribution with 7 class intervals. The class
intervals are 0 to < 10, 10 to < 20, ..., 60 to < 70. The number of observations
(frequencies) for the classes are 5, 12, 18, 14, 14, 13, and 8 respectively.
Question 8 of 9
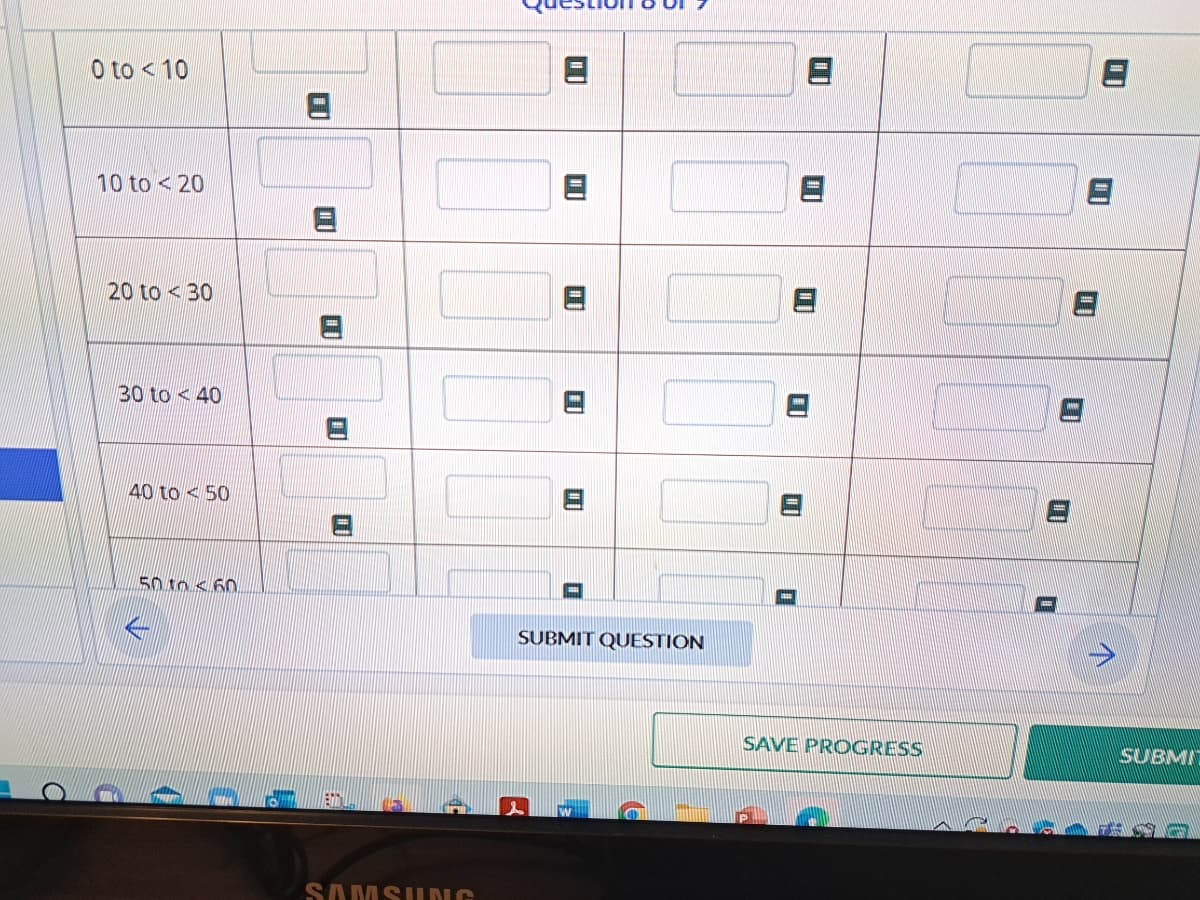
a. Complete the following frequency table for the distribution showing frequency,
relative frequency, cumulative frequency, and cumulative relative frequencies.
Round to four decimal places when necessary
Class
Frequency
Interval
to € 10
Relative
Frequency
SAMSUNG
Cumulative
Frequency
SUBMIT QUESTION
Cumulative Relative
SAVE PROGRESS
Frequency
SUBMIT ASS
Transcribed Image Text:a
0 to 10
10 to 20
20 to 30
30 to 40
40 to 50
50 to 60
SAMSUNG
SUBMIT QUESTION
SAVE PROGRESS
0
8
[
SUBMIT
Expert Solution
This question has been solved!
Explore an expertly crafted, step-by-step solution for a thorough understanding of key concepts.

Step by step
Solved in 3 steps

Recommended textbooks for you
Algebra & Trigonometry with Analytic Geometry
Algebra
ISBN:
9781133382119
Author:
Swokowski
Publisher:
Cengage
Algebra & Trigonometry with Analytic Geometry
Algebra
ISBN:
9781133382119
Author:
Swokowski
Publisher:
Cengage