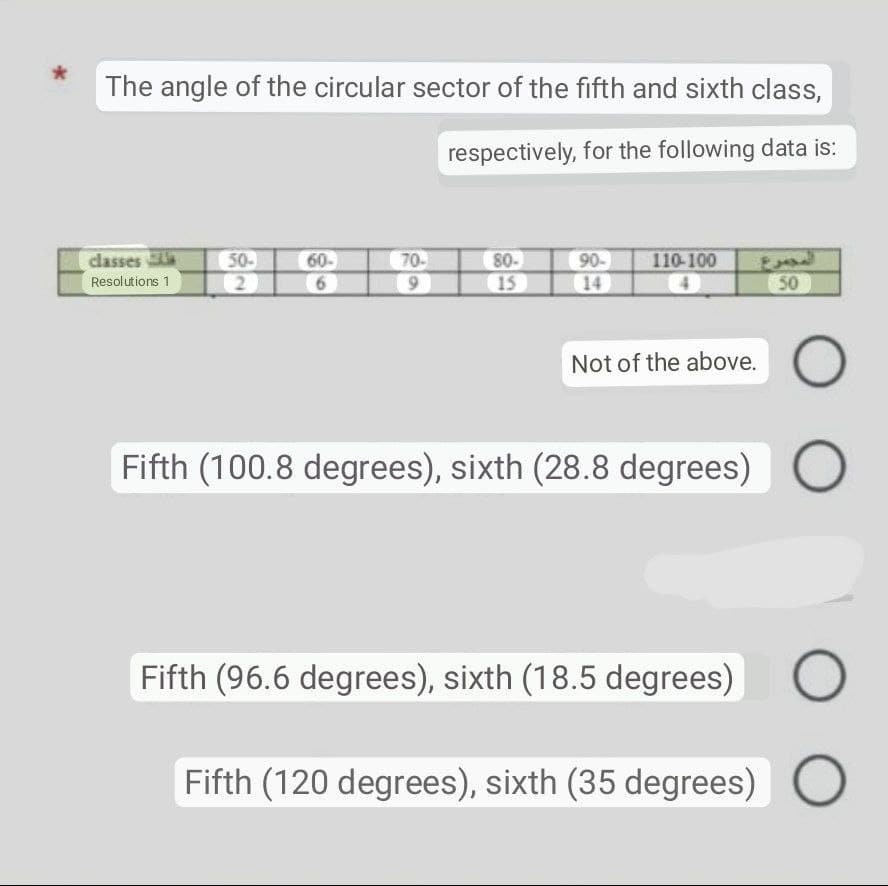
The angle of the circular sector of the fifth and sixth class, respectively, for the following data is: 50- 80- 90- 110-100 classes Resolutions 1 2 15 14 4 50 1816 60- 70- 9


Q: 4. Calculate the mean deviation from the following data. What light does it throw on the social…
A:
Q: Two different types of polishing solutions are being evaluated for possible use in tumble-polish…
A: Given that No. of polishing induced defect in first solution, x1 =253 No. of lenses were…
Q: 8. If three symmetrical dice are thrown, calculate the probability that the sum of numbers is 12.
A:
Q: The scores of 36 trainees assigned to three trainers and three training programs on a 50-point job…
A:
Q: The starting point of 31 successful team drives was recorded in an interval format below. Use these…
A: As per our guidelines we can solve first three sub part of question and rest can be reposted.…
Q: Problem: The following are the heights of a father and his eldest son, in inches: Height of the…
A: Using Excel function =CORREL()
Q: The daily salaries of security guards for 10 security agencies are as follows (in Php): 350, 400,…
A: Given data is350,400,375,420,500,470,380,450,520,460sample size(n)=10
Q: Which of the following formulas describes an autoregressive (AR) process?
A: Write the AR process (autoregressive process) of order p
Q: What is the probability ALL THREE circuits are Good?
A: Given: computer manufacturing process produces a circuit that is installed into a computer. The…
Q: a 90 percent confidence interval for a population mean indicates that
A: Given problem Given that a 90 percent confidence interval for a population mean indicates…
Q: . The averages of the Top 10 students in your class are as follows: 88, 89, 90, 91, 91, 92, 93,…
A: The averages of the Top 10 students in your class are as follows: 88, 89, 90, 91, 91, 92, 93, 94,…
Q: There is some research to indicate that different dog breeds differ in emotionality. To consider…
A: Since you have posted a question with multiple subparts, we will solve first three subparts for you.…
Q: (a) State the null hypothesis Ho and the alternative hypothesis H₁. Ho :O 0 H₁ :0 (b) Determine the…
A: It is given that Population proportion, p = 0.75 Sample size, n = 205 Favourable cases, X = 137…
Q: question 19 A regression was run to determine if there is a relationship between hours of TV…
A:
Q: 3. The data collected on 10 college students were shown below, X is the number of hours the subject…
A: For the given data Find all the required
Q: A data set has Maximum Value of 200 and Minimum Value of 67. (a) What is the range of the data…
A: Given Max value=200 Min value=67
Q: (2) Choose the one alternative that best completes the statement or answers the question. Assume two…
A: Assume that p1 and p2 are the true population proportions of 1st and 2nd populations, respectively.
Q: our twenty observations of Dr. Knowitall reveal the following information. Assume that the estimate…
A: Given: Margin of error E = 9% E = 0.09 Confidence level = 90% Formula Used: Sample size n =…
Q: Out of 300 people sampled, 198 had children. Based on this, construct a 90% confidence interval for…
A: Given that Sample size n =300 Favorable cases x =198 Sample proportion p^=x/n =198/300 =0.66
Q: The Acme Company manufactures widgets. The distribution of widget weights is bell-shaped. The widget…
A: Solution-: Given: μ=63,σ=10 We want find, (a) 68% of the widget weight lie between ..... and…
Q: Two newspaper vendors employ the same technique to earn a certain amount of money sometime in…
A: Given For vendor 1 For vendor 2 108 113 125 120 130…
Q: 21. The mean height of a Clydesdale horse is 72 inches with a standard deviation of 1.4 inches. What…
A: Mean(µ) = 72Standard deviations (σ) = 1.4X ~ N (µ, σ )= N(72, 1.4)
Q: A study is conducted to determine the association between Smoking and presence of Lung Cancer. The…
A: For the given data Find Cramer's V and interpret the result.
Q: Differentiate between nominal data and ordinal data. Give at least two examples of nominal and…
A: Here we have to Differentiate between nominal data and ordinal data.
Q: Road Safety statistics of a certain town over the last three years, the ten intersections having…
A: *Answer:
Q: 15. Which of the following is NOT a condition for inference when applying a 1-proportion z-test? a.…
A: The condition for inference when applying a 1-proportion z-test :
Q: Random variables X and Y have the means and standard deviations as given in the table to the right…
A: Solution
Q: While driving to work, Arceli passes through 3 stop lights. The probability distribution of the…
A:
Q: The number of accidents incurred by insured drivers in a given day (24 hours, starting from 6:00am)…
A:
Q: Two companies manufacture a rubber material intended for use in an automotive application. The part…
A:
Q: The researchers were interested in determining if there is evidence of a relationship between facial…
A: Given Facial Expression No pain Pain Total No pain 17 40 57 Pain 3 29 32 Total 20 69 89…
Q: 3. Use the following Table to calculate the minimum premium an insurance company should charge for a…
A: Given Type of insurance : Two year term life insurance Sum assured : $100000 Age : 40…
Q: The length of time it takes a car salesperson to close a deal on a car sale is assumed to be…
A:
Q: A 95 percent confidence interval for the mean of a population is to be constructed and must be…
A: formula for the sample size needed to estimate a population mean is
Q: This is a Free Response question. You can either: 1) type in and show all your work in the textbox…
A: Let Y represents height of fathers and X represents the heights of sons. Then, given that, uy= 70…
Q: The burning rates of two different solid-fuel propellants used in air crew escape systems are being…
A:
Q: study reported that about half of young adults continue to text and drive, despite the dangers. To…
A: To help control for the lurking variables a control is necessary for the experiment.
Q: Duration and Convexity (Part 2): A bond portfolio consists of a two-year zero-coupon bond with a…
A:
Q: gave the following data on their heights and weights. Height (inches) X 62 62 63 65 66 67…
A: X Y 62 120 62 140 63 130 65 150 66 142 67 130 68 135 68 175 70 149 72…
Q: The table below shows the distribution of the sizes of a random sample of 290 households that were…
A:
Q: 6. Show that if the class interval of a grouped distribution is less than one third of the…
A:
Q: An appliance manufacturer claims to have developed a compact microwave oven that consumes a mean of…
A:
Q: For each variable, determine whether it is best thought of as discrete or continuous. Variable (a)…
A: Quantitative variables: The variable that can record a numerical value is termed as a…
Q: Answer and show complete solution (not excel) In a construction project, rivets from a Hardware will…
A: From the given information we find the solution.
Q: Two chemical companies can supply a raw material. The concentration of a particular element in this…
A:
Q: To become an actuary, it is necessary to pass a series of 10 exams, including the most important…
A:
Q: A student believes that a certain 6-sided number cube, with the numbers 1 to 6, is unfair and is…
A: Given that A student believes that a certain 6-sided number cube, with the numbers 1 to 6, is…
Q: (No. 1) Given: μ = 48, s = 17, n=25 and x = 65 STATISTICAL TOOL: T-TEST: ONE SAMPLE MEAN Formula:…
A: Comment: As per the our company guidelines we are supposed to answer only one question. Kindly…
Q: The data below is 10 observations of Math SAT scores (x) and scores on Math placement test (y).…
A: The provided information is x y xy x2 y2 520 470 244400 270400 220900 560 641 358960 313600…
Q: Suppose that the hemoglobin levels among healthy females are normally distributed with a mean of…
A:

Step by step
Solved in 2 steps

- Use theorem 5.4.3 to form a proportion in which RS is a geometric mean. Hint RVSRST Exercises 1-6Use theorem 5.4.2 to form a proportion in which SV is a geometric mean. Hint: SVTRVS Exercises 1-6What are the lengths of the following dimensions in Figure 39-11? Alldimensions are in millimeters. a. Dimension A b. Dimension B c. Dimension C
- This sheet metal section shown in Figure 5-5 has five sets of drilled holes: A, B, C, D, and E. The holes within a set are equally spaced in the horizontal direction. Compute the horizontal distance between two consecutive holes for each set. All dimensions are in inches. A=_B=_C=_D=_E=_Mating parts are shown in Figure 29-16. The pins in the top piece fit into the holes in the bottom piece. All dimensions are in inches. Determine the following; a. The mean pin diameters b. The mean hole diameters c. The maximum dimension A d. The minimum dimension A e. The maximum dimension B f. The minimum dimension B g. The maximum total clearance between dimension C and dimension D h. The minimum total clearance between dimension C and dimension DAn agent for a property management company would like to be able to predict the monthly rental cost for apartments based on the size of the apartment as defined by square footage. A sample of the rent of 25 apartments in a college rental neighborhood was selected, and the information collected revealed the following: Apartment Size (Sq. Ft.) Monthly Rent ($) 1 850 950 2 1,450 1,600 3 1,085 1,200 4 1,232 1,500 5 718 950 6 1,485 1,700 7 1,136 1,650 8 726 935 9 700 875 10 956 1,150 11 1,100 1,400 12 1,285 1,650 13 1,985 2,300 14 1,369 1,800 15 1,175 1,400 16 1,225 1,450 17 1,245 1,100 18 1,259 1,700 19 1,150 1,200 20 896 1,150 21 1,361 1,600 22 1,040 1,650 23 755 1,200 24 1,000 800 25 1,200 1,750 e) Determine the coefficient of determination r2 and then completely interpret…
- An agent for a property management company would like to be able to predict the monthly rental cost for apartments based on the size of the apartment as defined by square footage. A sample of the rent of 25 apartments in a college rental neighborhood was selected, and the information collected revealed the following: Apartment Size (Sq. Ft.) Monthly Rent ($) 1 850 950 2 1,450 1,600 3 1,085 1,200 4 1,232 1,500 5 718 950 6 1,485 1,700 7 1,136 1,650 8 726 935 9 700 875 10 956 1,150 11 1,100 1,400 12 1,285 1,650 13 1,985 2,300 14 1,369 1,800 15 1,175 1,400 16 1,225 1,450 17 1,245 1,100 18 1,259 1,700 19 1,150 1,200 20 896 1,150 21 1,361 1,600 22 1,040 1,650 23 755 1,200 24 1,000 800 25 1,200 1,750 i) Determine a 95% interval estimate for the average rent of apartments with 1000…The following data give the number of defective motors received in 20 differentshipments. 8 12 10 16 10 25 21 15 17 526 21 29 8 6 21 10 17 15 13 Construct a dot plot for these data.Suppose that a customer is purchasing a car. He conducts an experiment in which he puts 10 gallons of gas in the car and drives it until it runs out of gas. He conducts this experiment 15 times on each car and records the number of miles driven. Full data set Car 1 216 243 205 242 239 297 295 172 270 251 165 310 265 316 278 Car 2 231 220 223 205 245 257 242 292 248 252 287 255 250 293 251 ..... Describe each data set, that is determine the shape, center, and spread. Sample mean for Car 1 x=__________mi / 10 gal (Type an integer or decimal rounded to one decimal place as needed.) Sample mean for Car 2 x=___________mi / 10 gal (Type an integer or decimal rounded to one decimal place as needed.) Median for Car 1 M=____________mi / 10 gal (Type an integer or decimal rounded to one decimal place as needed.) Median for Car 2 M=___________mi / 10 gal (Type…
- In a bumper test, three test vehicles of each three types of autos were crashed into a barrier at 5 mph, and the resulting damage was estimated. Crashes were from three angles: head-on, slanted, and rear-end. The results are shown below. Head-on Goliath Varmint Weasel 780. 1,780. 2,240 1,440. 1,690. 1,640 810. 1,600. 1,770 Slant. 1,460. 1,820. 2,030 1,740. 1,720. 1,500 1,250. 1,680. 2,480 Rear-end. 710. 890. 1,690 1,260. 1,570. 1,630 920. 1,270. 1,240 I need a table of Means, Two-Factor ANOVA with replication (Factor 1 (Angle), Factor 2 (Vehicle), Interaction, Error, Total). Perform Tukey multiple comparison tests with error rate: 0.05 and 0.01. Tukey Simultaneous comparison t-values (d.f.=18) with critical values for…For this grouped data set: Scores | Frequencies 30-34 | 7 25-29 | 9 20-24 | 14 15-19 | 10 10-14 | 8 5-9 | 2 What is the Skewness and Kurtosis of the data set?The manager of a fleet of automobiles is testing two brands of radial tires. He assigns one tire of each brand at random to the two rear wheels of eight cars and runs the cars until the tires wear out. The data (in kilometers) are shown below: Car Brand 1 Brand 2 1 34900 36700 2 45500 47200 3 37100 37700 4 32000 31400 5 48900 47800 6 32800 36900 7 38500 38900 8 30100 31800 Find a 95% confidence interval on the difference in mean mileage. Assume that the differences of the distances are approximately normally distributed.


