The article "Mix Design for Optimal Strength Development of Fly Ash Concrete" (Cement and Concrete Research, 1989, Vol. 19, No. 4, pp. 634-640) investigates the compressive strength of concrete when mixed with fly ash (a mixture of silica, alumina, iron, magnesium oxide, and other ingredients). The compressive strength for nine samples in dry conditions on the twenty-eighth day are as follows (in megapascals): 40.2 30.4 28.9 30.5 22.4 25.8 18.4 14.2 15.3 Find a 95% prediction interval on the next sample that will be tested. Assume population is approximately normally distributed.
Q: An artide in the IEEE Transactions on Components, Hybrids, and Manufacturing Technology (Vol. 15,…
A: Solution: From the given information,
Q: The article “Effects of Diets with Whole Plant-Origin Proteins Added with Different Ratiosof…
A:
Q: An artide in the IEEE Transactions on Components, Hybrids, and Manufacturing Technology (Vol. 15,…
A:
Q: An artide in the IEEE Transactions on Components, Hybrids, and Manufacturing Technology (Vol. 15,…
A:
Q: In the article “Groundwater Electromagnetic Imaging in Complex Geological and Topographical Regions:…
A:
Q: An article in the Journal of Quality Technology (Vol. 13, No. 2, 1981, pp. 111–114) describes an…
A: Introduction - ANOVA- Analysis of variance is an analysis tool used in statistics that splits an…
Q: The article "Change in Creep Behavior of Plexiform Bone with Phosphate Ion Treatment" (R. Regimbal,…
A:
Q: Exposure to microbial products, especially endotoxin, may have an impact on vulnerability to…
A: Given information: The data represents the Endotoxin concentration values of Urban homes and Farm…
Q: An artide in the IEEE Transactions on Components, Hybrids, and Manufacturing Technology (Vol. 15,…
A: given
Q: The article "Hydrogeochemical Characteristics of Groundwater in a Mid-Western Coastal Aquifer…
A: Since you have posted a question with multiple sub-parts, we will solve first three sub-parts for…
Q: The authors of the article “Predictive Model for PittingCorrosion in Buried Oil and Gas…
A: a. The representative strength of the vehicle is approximately 134 and 135. The table represents the…
Q: The article “Differences in Susceptibilities of Different Cell Lines to Bilirubin Damage” (K. Ngai,…
A:
Q: As part of a pilot study aimed at determining the daily consumption of water (in litres) across…
A:
Q: What is the standard error of the difference between the means of population 1 and population 2,…
A: Answer:-
Q: Do people who work for non-profit organizations differ from those who work at for-profit…
A: For the given statement select the correct choice
Q: The spike stature of the plants grown from the seeds of the porcine separates (Dactylis glomerata L)…
A: Given nX=11, nY=10 X (x-x__)2 Y (y-y__)2 5 1 12 3.61 6 0 9 1.21 8 4 11 0.81 7 1 9 1.21…
Q: Cloud seeding has been studied for many decades as a weather modification procedure (for an…
A: Introduction: Denote μ as the true population mean amount of rainfall from seeded clouds.
Q: 6.4.10 In a study of factors thought to be responsible for the adverse effects of smoking on human…
A: Given Information:
Q: An article in Plant Disease, "Effect of Nitrogen and Potassium Fertilizer Rates on Severity of…
A: Given:
Q: An article in the Journal of the Electrochemical Society (Vol. 139, No. 2, 1992, pp. 524–532)…
A: Introduction - ANOVA - Analysis of variance is an analysis tool used that splits an observed…
Q: .A study was conducted to determine the level of cyanide in 20 exposed spot (soil and water) within…
A:
Q: Consider the following measurements of blood hemoglobin concentrations (in g/dL) from three human…
A: Test hypotheses: There are 3 populations. Denote the true mean of each of the 3 populations as μ1,…
Q: Stressed-Out Bus Drivers. Previous studies have shown that urban bus drivers have an extremely…
A: (a) Procedures to draw the normal probability plot, boxplot, histogram and stem and leaf plot:…
Q: An article in Plant Disease, "Effect of Nitrogen and Potassium Fertilizer Rates on Severity of…
A:
Q: Samples of starting annual salaries for individuals entering the public accounting and financial…
A: a).Given, n1=10n2=10α=0.05 The hypothesis to be tested here is- H0: There is no difference between…
Q: Blood cocaine concentration (mg/L) was determinedboth for a sample of individuals who had died…
A: a.
Q: The article "Efficient Pyruvate Production by a Multi-Vitamin Auxotroph of Torulopsis glabrata: Key…
A:
Q: The article "Optimization of Medium Composition for Lipase Production by Candida rugosa NCIM 3462…
A: Hey there! Thank you for posting the question. Since your question has more than 3 parts, we are…
Q: The article "Hydrogeochemical Characteristics of Groundwater in a Mid-Western Coastal Aquifer…
A: (a) Use EXCEL Procedure to obtain the values. Follow the instruction to obtain the values as…
Q: An article in the IEEE Transactions on Components, Hybrids, and Manufacturing Technology (Vol. 15,…
A:
Q: An article reported data from a study in which both a baseline gasoline mixture and a reformulated…
A: Scatter plot: Excel Procedure: Enter the Age and Baseline in Excel>Select the Age and…
Q: Consider the following measurements of blood hemoglobin concentrations (in g/dL) from three human…
A: Test hypotheses: There are 3 populations. Denote the true mean of each of the 3 populations as μ1,…
Q: Consider the following table where the production quantity of a welding process is presented for…
A: Given data:
Q: + Cloud seeding has been studied for many decades as a weather modification procedure (for an…
A: Given information: Use the given data to form the excel table: x x-x¯ x-x¯2 18 -8.035…
Q: Ah artičlé in thế Journal of Sports Science (1987, Vol. 5, pp. 261-271) presents results of an…
A: Thanks for giving opportunity to serve for bartleby students, Hey, There ! Thank you for posting…
Q: The authors of the paper "Dynamics of Canopy Structure and Light Interception in Pinus elliottii,…
A: Introduction: Denote μ1, μ2 as the true population mean tree density, that is, the mean number of…
Q: In an experiment to determine the impacts of domestic and industrial waste accumulation on plant…
A:
Q: Following are the protein contents measured in two types of species: Species 1: 0.72 1.12 0.81 0.89…
A: Given data is appropriate for testing of hypothesis to test t-test for difference of means. Because…
Q: The article "Improved Bioequivalence Assessment of Topical Dermatological Drug Products Using…
A: Solution: State the hypotheses. Null hypothesis: That is, the mean amount absorbed does not differ…
Q: An artide in the JEEE Transactions on Components, Hybrids, and Manufacturing Technology (Vol. 15,…
A: Given, By using one way ANOVA for single factor. Excel -data- data analysis- anova-single factor
Q: In a study of factors thought to be responsible for the adverse effects of smoking on human…
A: Introduction: Denote μ1, μ2 as the true population mean cadmium levels (nanograms per gram) in…
Q: In the article “Assessment of Dermatopharmacokinetic Approach in the Bioequivalence Determination of…
A: Here, MINITAB software is used to obtain normal probability plot. If X has the lognormal…
Q: 6.4.10. In a study of factors thought to be responsible for the adverse effects of smoking on human…
A: Given information: A study to study the factors which are responsible for the adverse effects of…
Q: The article "Genotype-Environment Interactions and Phenotypic_Stability Analyses of Linseed in…
A: a. The null and the alternative hypotheses are given below: R-Code: R-Output: Thus, the P-value…
Q: An experiment to determine the effect of four different types of engine oil (A, B, C, and D) on the…
A: Source of variation SS DF MS F P-value F-crict Sample 0.00012 3 3.80E-05 1.1203 3.4903…
Q: The Goodman Tire and Rubber Company periodically tests its tires for tread wear under simulated road…
A: Given: Sample Size n=3 Number of Sample k=20
Q: The article "Anodic Fenton Treatment of Treflan MTF" (D. Saltmiras and A. Lemley, Journal of…
A:
Q: Lactation promotes a temporary loss of bone mass to provide adequate amounts of calcium for milk…
A: Let μD represents the true average difference between total body bone mineral content during…
Q: To evaluate the coagulation effects of three drugs, 30 healthy volunteers were randomly assigned…
A: Given Information Consider the given data: Group 1 Group 2 Group 3 36.8 40 32.9 34.4 35.5…
Q: The article "Effect of Granular Subbase Thickness on Airfield Pavement Structural Response" (K.…
A:
How do you solve? Ref W9A3
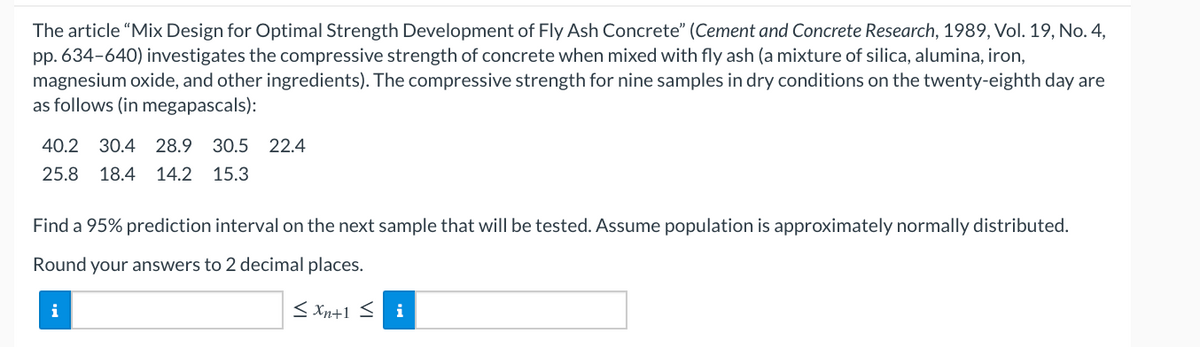
Trending now
This is a popular solution!
Step by step
Solved in 2 steps with 2 images
- The article “Hydrogeochemical Characteristics of Groundwater in a Mid-Western CoastalAquifer System” (S. Jeen, J. Kim, et al., Geosciences Journal, 2001:339–348) presentsmeasurements of various properties of shallow groundwater in a certain aquifer system inKorea. Following are measurements of electrical conductivity (in microsiemens percentimeter) for 23 water samples.2099 528 2030 1350 1018 384 14991265 375 424 789 810 522 513488 200 215 486 257 557 260461 500Find the mean.Find the standard deviation.Find the median.Construct a dotplot.Find the 10% trimmed mean.Find the first quartile.Find the third quartile.Find the interquartile range.Construct a boxplot.Which of the points, if any, are outliers?If a histogram were constructed, would it be skewed to the left, skewed to the right, orapproximately symmetric?Determine the kurtosis if the data given is a sample.Here is a dataset containing plant growth measurements of plants grown in solutions of commonly-found chemicals in roadway runoff.Phragmites australis, a fast-growing non-native grass common to roadsides and disturbed wetlands of Tidewater Virginia, was grown in a greenhouse and watered with either: Distilled water (control); A weak petroleum solution (representing standard roadway runoff); Sodium chloride solution; Magnesium chloride solution; De-icing brine (50% sodium chloride and 50% magnesium chloride).Twenty grass preparations were used for each solution, and total growth (in cm) was recorded after watering every other day for 40 days.-Perform the correct statistical test to determine the p-value.-Report your answer rounded to four decimal places.-You should use formulas, functions, and the Data Analysis ToolPak in MS Excel to avoid additive rounding errors. Here are some useful functions: =t.test(array1,array2,tails,type) Produces a p-value for any…
- The article “Differences in Susceptibilities of Different Cell Lines to Bilirubin Damage” (K. Ngai, C. Yeung, and C. Leung, Journal of Paediatric Child Health, 2000:36–45) reports an investigation into the toxicity of bilirubin on several cell lines. Ten sets of human liver cells and 10 sets of mouse fibroblast cells were placed into solutions of bilirubin in albumin with a 1.4 bilirubin/albumin molar ratio for 24 hours. In the 10 sets of human liver cells, the average percentage of cells surviving was 53.9 with a standard deviation of 10.7. In the 10 sets of mouse fibroblast cells, the average percentage of cells surviving was 73.1 with a standard deviation of 9.1. Find a 98% confidence interval for the difference in survival percentages between the two cell lines.In the article “Groundwater Electromagnetic Imaging in Complex Geological and Topographical Regions: A Case Study of a Tectonic Boundary in the French Alps” (S. Houtot, P. Tarits, et al., Geophysics, 2002:1048–1060), the pH was measured for several water samples in various locations near Gittaz Lake in the French Alps. The results for 11 locations on the northern side of the lake and for 6 locations on the southern side are as follows: Northern side: 8.1 8.2 8.1 8.2 8.2 7.4 7.3 7.4 8.1 8.1 7.9 Southern side: 7.8 8.2 7.9 7.9 8.1 8.1 Find a 98% confidence interval for the difference in pH between the northern and southern side.The authors of the article “Predictive Model for PittingCorrosion in Buried Oil and Gas Pipelines”(Corrosion, 2009: 332–342) provided the data on whichtheir investigation was based.a. Consider the following sample of 61 observations onmaximum pitting depth (mm) of pipeline specimensburied in clay loam soil. 0.41 0.41 0.41 0.41 0.43 0.43 0.43 0.48 0.480.58 0.79 0.79 0.81 0.81 0.81 0.91 0.94 0.941.02 1.04 1.04 1.17 1.17 1.17 1.17 1.17 1.171.17 1.19 1.19 1.27 1.40 1.40 1.59 1.59 1.601.68 1.91 1.96 1.96 1.96 2.10 2.21 2.31 2.462.49 2.57 2.74 3.10 3.18 3.30 3.58 3.58 4.154.75 5.33 7.65 7.70 8.13 10.41 13.44Construct a stem-and-leaf display in which the twolargest values are shown in a last row labeled HI.b. Refer back to (a), and create a histogram based oneight classes with 0 as the lower limit of the firstclass and class widths of .5, .5, .5, .5, 1, 2, 5, and 5,respectively.c. The accompanying comparative boxplot fromMinitab shows plots of pitting depth for four differenttypes of soils.…
- The spike stature of the plants grown from the seeds of the porcine separates (Dactylis glomerata L) collected from the University campus and İbradı Eynif pasture are given below. In this plant, compare whether there is a difference between regions in terms of spike height. Virgo Height (cm) Data obtained from plants collected from university campus 5 6 8 7 8 6 5 5 4 6 6 Data obtained from plants collected from Eynif pasture 12 9 11 9 9 11 9 10 11 10 Note: Your results interpretation according to two different possibilities (Do it separately, assuming that it is 0.07 and 0.04).The table below shows the numbers of bushels of barley cultivated per acre for 12 one-acre plots of land for two different strains of barley, PHT-34 and CBX-21. PHT-34 CBX-21 43 55 49 46 47 43 38 44 47 45 45 49 50 47 46 59 46 52 46 49 45 48 43 51 Determine the minimum data value, the quartiles, and the maximum data value for the PHT-34 and CBX-21 data sets. PHT-34 CBX-21 min Q1 Q2 Q3 maxExposure to microbial products, especially endotoxin,may have an impact on vulnerability to allergic diseases. The article “Dust Sampling Methods for Endotoxin—An Essential, But Underestimated Issue” (Indoor Air,2006: 20–27) considered various issues associated withdetermining endotoxin concentration. The following dataon concentration (EU/mg) in settled dust for one sampleof urban homes and another of farm homes was kindlysupplied by the authors of the cited article. U: 6.0 5.0 11.0 33.0 4.0 5.0 80.0 18.0 35.0 17.0 23.0F: 4.0 14.0 11.0 9.0 9.0 8.0 4.0 20.0 5.0 8.9 21.0 9.2 3.0 2.0 0.3 a. Determine the sample mean for each sample. Howdo they compare?b. Determine the sample median for each sample. Howdo they compare? Why is the median for the urbansample so different from the mean for that sample?c. Calculate the trimmed mean for each sample bydeleting the smallest and largest observation. Whatare the corresponding trimming percentages? Howdo the values of these…
- Wild irises are beautiful flowers found throughout the United States, Canada, and northern Europe. This problem concerns the length of the sepal (leaf-like part covering the flower) of different species of wild iris. Data are based on information taken from an article by R. A. Fisher in Annals of Eugenics (Vol. 7, part 2, pp. 179 -188). Measurements of sepal length in centimeters from random samples of Iris setosa (I), Iris versicolor (II), and Iris virginica (III) are as follows below. I II III 5.5 5.2 6.7 4.4 6.5 5.7 5.2 6.9 4.1 5.9 4.4 7.8 4.3 5.5 5.7 5.3 6.4 6.1 5.8 5.5 6.9 Shall we reject or not reject the claim that there are no differences among the population means of sepal length for the different species of iris? Use a 10% level of significance. (a) What is the level of significance? (b) Find SSTOT, SSBET, and SSW and check that SSTOT = SSBET + SSW. (Use 3 decimal places.) SSTOT = ? SSBET = ? SSW = ? Find d.f.BET, d.f.W, MSBET, and…Wild irises are beautiful flowers found throughout the United States, Canada, and northern Europe. This problem concerns the length of the sepal (leaf-like part covering the flower) of different species of wild iris. Data are based on information taken from an article by R. A. Fisher in Annals of Eugenics (Vol. 7, part 2, pp. 179 -188). Measurements of sepal length in centimeters from random samples of Iris setosa (I), Iris versicolor (II), and Iris virginica (III) are as follows below. I II III 5.5 5.2 6.8 4.6 6.5 5.3 5.1 6.1 4.4 5.5 4.1 7.9 4.1 5.1 5.9 5.4 6.1 6.9 5.4 5.1 6.6 Shall we reject or not reject the claim that there are no differences among the population means of sepal length for the different species of iris? Use a 5% level of significance. (a) What is the level of significance?State the null and alternate hypotheses. Ho: ?1 = ?2 = ?3; H1: Exactly two means are equal.Ho: ?1 = ?2 = ?3; H1: Not all the means are equal. Ho: ?1 = ?2 = ?3; H1:…Wild irises are beautiful flowers found throughout the United States, Canada, and northern Europe. This problem concerns the length of the sepal (leaf-like part covering the flower) of different species of wild iris. Data are based on information taken from an article by R. A. Fisher in Annals of Eugenics (Vol. 7, part 2, pp. 179 -188). Measurements of sepal length in centimeters from random samples of Iris setosa (I), Iris versicolor (II), and Iris virginica (III) are as follows below. I II III 5.7 5.1 6.5 4.7 6.2 5.1 4.7 6.6 4.7 5.8 4.9 7.5 4.6 5.2 5.3 5.3 6.2 6.2 5.4 5.8 6.4 (b) Find SSTOT, SSBET, and SSW and check that SSTOT = SSBET + SSW. (Use 3 decimal places.) SSTOT = SSBET = SSW = Find d.f.BET, d.f.W, MSBET, and MSW. (Use 4 decimal places for MSBET, and MSW.) dfBET = dfW = MSBET = MSW = Find the value of the sample F statistic. (Use 2 decimal places.)What are the degrees of freedom? (numerator) (denominator)