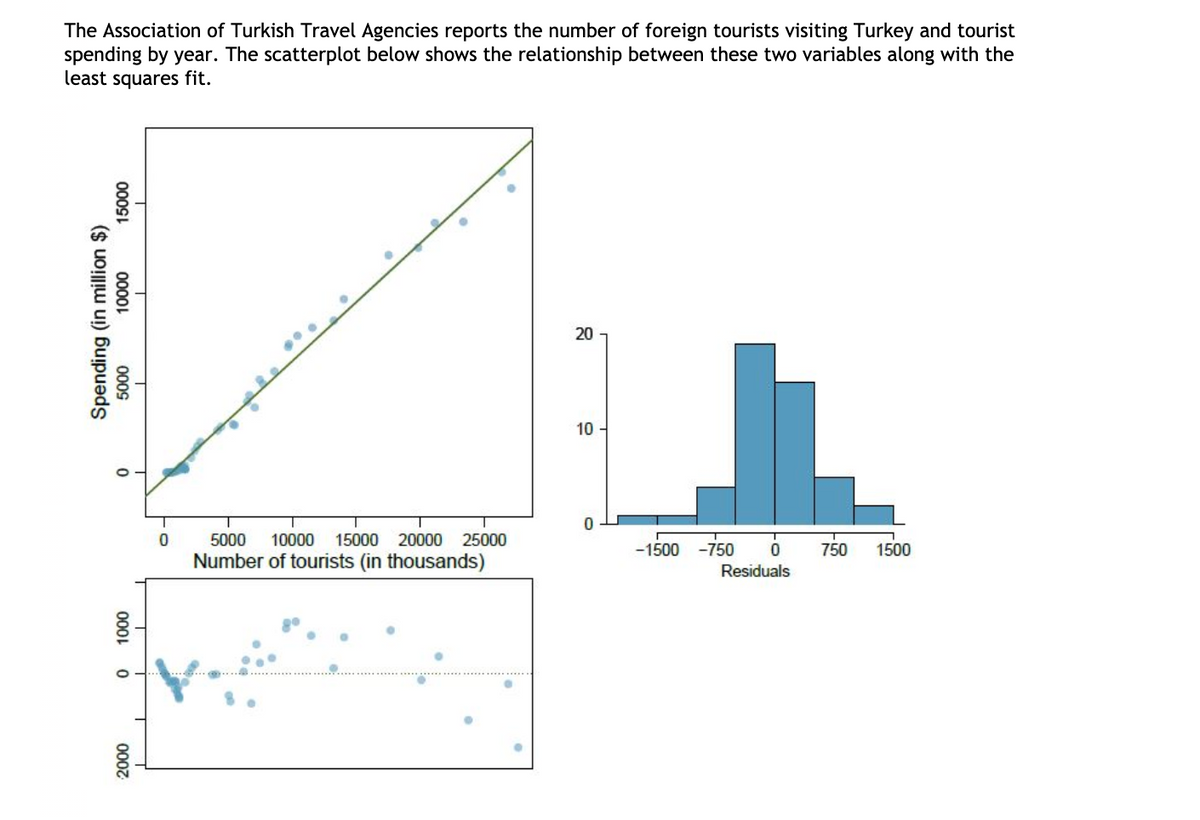
The Association of Turkish Travel Agencies reports the number of foreign tourists visiting Turkey and tourist spending by year. The scatterplot below shows the relationship between these two variables along with the least squares fit. 20 10 5000 10000 15000 20000 25000 -1500 -750 750 1500 Number of tourists (in thousands) Residuals 000s 0000L 0009 000L 0007 Spending (in million $)


Angles in Circles
Angles within a circle are feasible to create with the help of different properties of the circle such as radii, tangents, and chords. The radius is the distance from the center of the circle to the circumference of the circle. A tangent is a line made perpendicular to the radius through its endpoint placed on the circle as well as the line drawn at right angles to a tangent across the point of contact when the circle passes through the center of the circle. The chord is a line segment with its endpoints on the circle. A secant line or secant is the infinite extension of the chord.
Arcs in Circles
A circular arc is the arc of a circle formed by two distinct points. It is a section or segment of the circumference of a circle. A straight line passing through the center connecting the two distinct ends of the arc is termed a semi-circular arc.
2. Can you please help me understand theese grapsh by answering theese question. THank you in advance.
Given,
The Association of Turkish Travel Agencies reports the number of foreign tourists visiting Turkey and tourist spending by year. Three plots are provided: scatter- plot showing the relationship between these two variables along with the least squares fit, residuals plot, and histogram of residuals.

Trending now
This is a popular solution!

Step by step
Solved in 2 steps


