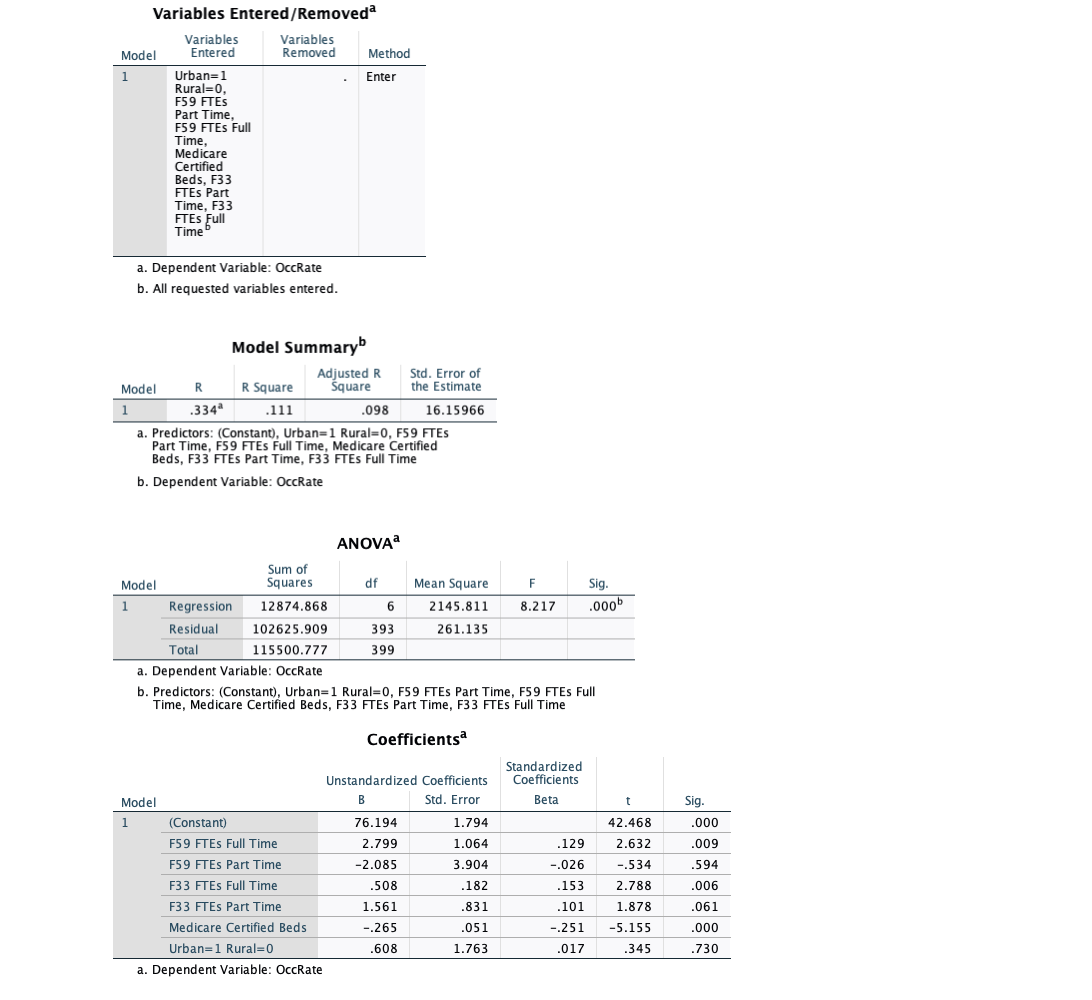
The attached images show linear regression analysis to evaluate the ability of independent variables full and part-time FTEs, number of Medicare certified beds and urban vs. rural setting to predict dependent variable, occupancy rate.


Correlation
Correlation defines a relationship between two independent variables. It tells the degree to which variables move in relation to each other. When two sets of data are related to each other, there is a correlation between them.
Linear Correlation
A correlation is used to determine the relationships between numerical and categorical variables. In other words, it is an indicator of how things are connected to one another. The correlation analysis is the study of how variables are related.
Regression Analysis
Regression analysis is a statistical method in which it estimates the relationship between a dependent variable and one or more independent variable. In simple terms dependent variable is called as outcome variable and independent variable is called as predictors. Regression analysis is one of the methods to find the trends in data. The independent variable used in Regression analysis is named Predictor variable. It offers data of an associated dependent variable regarding a particular outcome.
The attached images show linear
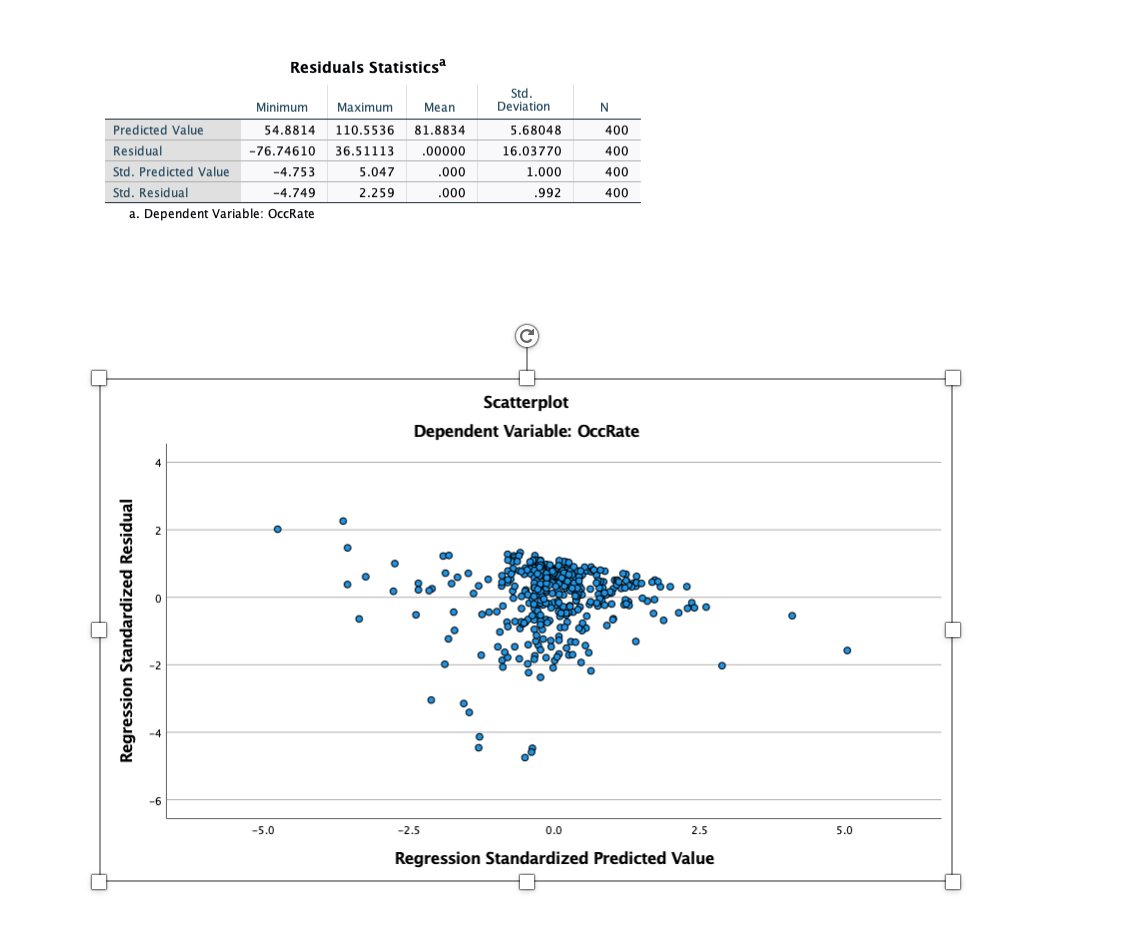
How do you interpret these results, what are the basic assumptions for regression analysis?


Trending now
This is a popular solution!

Step by step
Solved in 2 steps


