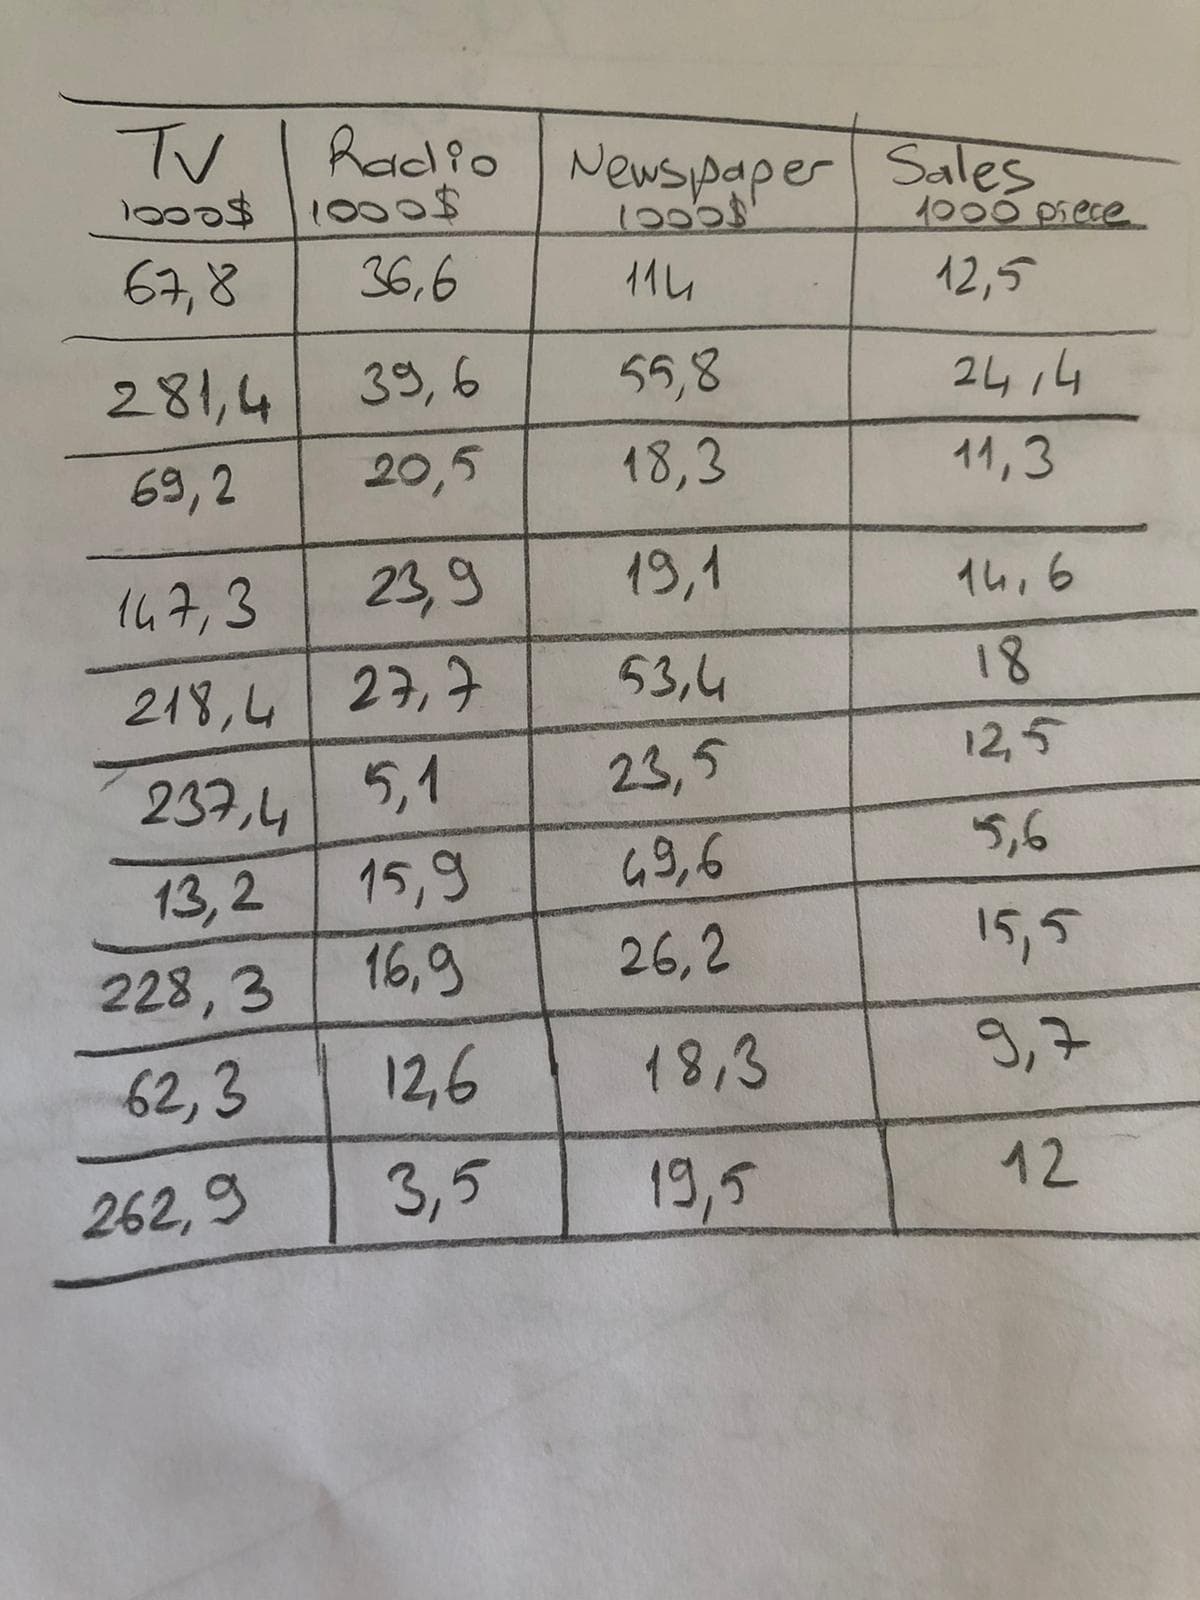
A researcher collected statistics on the sales amount of a product in 120 different markets and the advertising budgets used in TV, radio and newspaper media channels for each of these markets. The sales amount are expressed in 1000 units, and the budgets are expressed in 1000 $. The researcher wants to create a simple linear regression model by choosing one among the TV, radio and newspaper advertising budgets to explain the amount of sales. a) Which variable should this researcher choose as an independent variable to the simple regression model? Explain your decision by providing its statistical basis.(use formula) b) Construct the simple linear regression model using the argument you chose and write the equation of the model. Comment b0 and b1.(not excel use formula please) c) Test whether there is a statistically significant, linear relationship between the independent variable and the dependent variable by establishing the relevant hypotheses at the level of α = 0.05 significance. Explain your decision and comment.(not excel use formula)


Correlation
Correlation defines a relationship between two independent variables. It tells the degree to which variables move in relation to each other. When two sets of data are related to each other, there is a correlation between them.
Linear Correlation
A correlation is used to determine the relationships between numerical and categorical variables. In other words, it is an indicator of how things are connected to one another. The correlation analysis is the study of how variables are related.
Regression Analysis
Regression analysis is a statistical method in which it estimates the relationship between a dependent variable and one or more independent variable. In simple terms dependent variable is called as outcome variable and independent variable is called as predictors. Regression analysis is one of the methods to find the trends in data. The independent variable used in Regression analysis is named Predictor variable. It offers data of an associated dependent variable regarding a particular outcome.
A researcher collected statistics on the sales amount of a product in 120 different markets and the advertising budgets used in TV, radio and newspaper media channels for each of these markets. The sales amount are expressed in 1000 units, and the budgets are expressed in 1000 $. The researcher wants to create a simple linear regression model by choosing one among the TV, radio and newspaper advertising budgets to explain the amount of sales.
a) Which variable should this researcher choose as an independent variable to the simple regression model? Explain your decision by providing its statistical basis.(use formula)
b) Construct the simple linear regression model using the argument you chose and write the equation of the model. Comment b0 and b1.(not excel use formula please)
c) Test whether there is a statistically significant, linear relationship between the independent variable and the dependent variable by establishing the relevant hypotheses at the level of α = 0.05 significance. Explain your decision and comment.(not excel use formula)


Trending now
This is a popular solution!

Step by step
Solved in 6 steps


