the Baseball 20 data, which report information on the 2018 Mlajor eball season. ease explain steps and how to calculate in Excel) Rank the teams by the number of wins and their total team salary. Use the aificance level. Compute the coefficient of rank correlation between the two variables. ( wer to 4 decimal places.) State the null and alternate hypotheses. State the decision rule. (Round your answer to 3 decimal places.) Compute the value of test statistic. (Round your answer to 3 decimal p - What is your decision regarding Ho? Can we conclude that there is a positive correlation between the ranks of ry? Yes No Assume that the distributions of team salaries for the American League ane gue do not follow the normal distribution. - State the null and alternate hypotheses. State the decision rule. (Negative amount should be indicated by a m: und your answers to 2 decimal places.) Compute the value of z (Round vour answer to 4 decimal places.)
the Baseball 20 data, which report information on the 2018 Mlajor eball season. ease explain steps and how to calculate in Excel) Rank the teams by the number of wins and their total team salary. Use the aificance level. Compute the coefficient of rank correlation between the two variables. ( wer to 4 decimal places.) State the null and alternate hypotheses. State the decision rule. (Round your answer to 3 decimal places.) Compute the value of test statistic. (Round your answer to 3 decimal p - What is your decision regarding Ho? Can we conclude that there is a positive correlation between the ranks of ry? Yes No Assume that the distributions of team salaries for the American League ane gue do not follow the normal distribution. - State the null and alternate hypotheses. State the decision rule. (Negative amount should be indicated by a m: und your answers to 2 decimal places.) Compute the value of z (Round vour answer to 4 decimal places.)

Glencoe Algebra 1, Student Edition, 9780079039897, 0079039898, 2018
18th Edition
ISBN:9780079039897
Author:Carter
Publisher:Carter
Chapter10: Statistics
Section10.4: Distributions Of Data
Problem 19PFA

Related questions
Question
Please help me with the following question
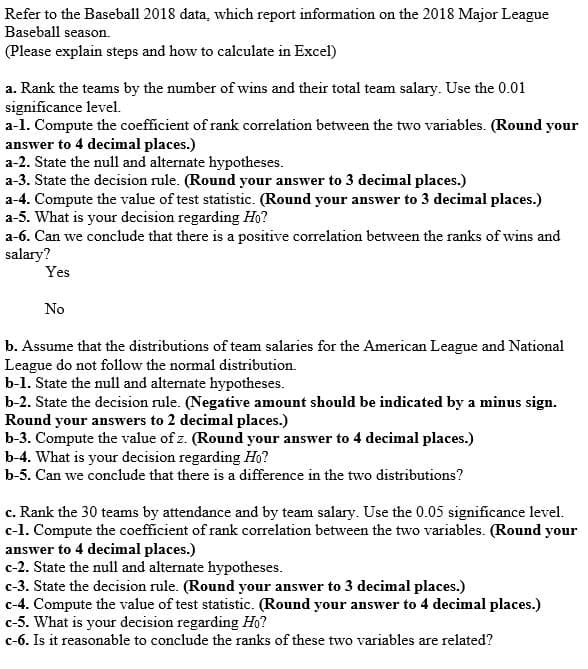
Transcribed Image Text:Refer to the Baseball 2018 data, which report information on the 2018 Major League
Baseball season.
(Please explain steps and how to calculate in Excel)
a. Rank the teams by the number of wins and their total team salary. Use the 0.01
significance level.
a-1. Compute the coefficient of rank correlation between the two variables. (Round your
answer to 4 decimal places.)
a-2. State the null and alternate hypotheses.
a-3. State the decision rule. (Round your answer to 3 decimal places.)
a-4. Compute the value of test statistic. (Round your answer to 3 decimal places.)
a-5. What is your decision regarding Họ?
a-6. Can we conclude that there is a positive correlation between the ranks of wins and
salary?
Yes
No
b. Assume that the distributions of team salaries for the American League and National
League do not follow the normal distribution.
b-1. State the null and alternate hypotheses.
b-2. State the decision rule. (Negative amount should be indicated by a minus sign.
Round your answers to 2 decimal places.)
b-3. Compute the value of z. (Round your answer to 4 decimal places.)
b-4. What is your decision regarding Ho?
b-5. Can we conclude that there is a difference in the two distributions?
c. Rank the 30 teams by attendance and by team salary. Use the 0.05 significance level.
c-1. Compute the coefficient of rank correlation between the two variables. (Round your
answer to 4 decimal places.)
c-2. State the null and alternate hypotheses.
c-3. State the decision rule. (Round your answer to 3 decimal places.)
c-4. Compute the value of test statistic. (Round your answer to 4 decimal places.)
c-5. What is your decision regarding Ho?
c-6. Is it reasonable to conclude the ranks of these two variables are related?
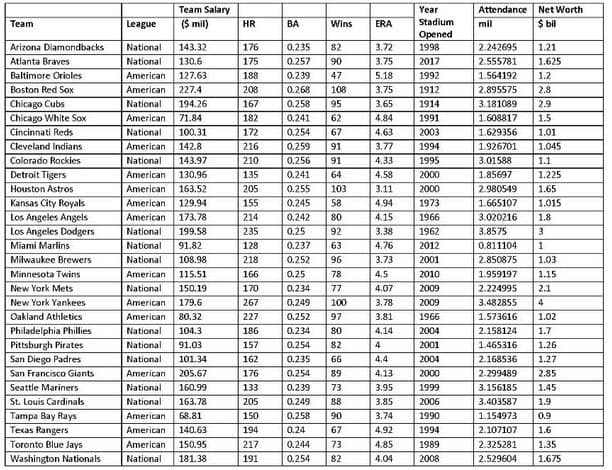
Transcribed Image Text:Attendance Net Worth
$ bil
Team Salary
Year
Stadium
Team
League
($ mil)
HR
BA
Wins
ERA
mil
Opened
1998
Arizona Diamondbacks
National
143.32
176
0.235
82
3,72
2.242695
1.21
Atlanta Braves
National
130.6
175
0.257
90
3,75
2017
2.555781
1.625
Baltimore Orioles
American
127.63
188
0.239
47
5.18
1992
1.564192
1.2
Boston Red Sox
American
227.4
208
0.268
108
3.75
1912
2.895575
2.8
Chicago Cubs
National
194.26
167
0.258
95
3.65
1914
3.181089
2.9
Chicago White Sox
American
71.84
182
0.241
62
4.84
1991
1.608817
1.5
Cincinnati Reds
National
100.31
172
0.254
67
4.63
2003
1.629356
1.01
Cleveland Indians
American
142.8
216
0.259
91
3.77
1994
1.926701
1.045
Colorado Rockies
National
143.97
210
0.256
91
4.33
1995
3.01588
1.1
Detroit Tigers
American
130.96
135
0.241
64
4.58
2000
1.85697
1.225
Houston Astros
American
163.52
205
0.255
103
3.11
2000
2.980549
1.65
Kansas City Royals
Los Angeles Angels
Los Angeles Dodgers
American
129.94
155
0.245
58
4.94
1973
1.665107
1.015
American
173.78
214
0.242
80
4.15
1966
3.020216
1.8
National
199.58
235
0.25
92
3.38
1962
3.8575
3
Miami Marlins
National
91.82
128
0.237
63
4.76
2012
0.811104
1
Milwaukee Brewers
National
108.98
218
0.252
96
3.73
2001
2.850875
1.03
Minnesota Twins
American
115.51
166
0.25
78
4.5
2010
1.959197
1.15
New York Mets
National
150.19
170
0.234
77
4.07
2009
2.224995
2.1
New York Yankees
American
179.6
267
0.249
100
3,78
2009
3.482855
4
Oakland Athletics
American
80.32
227
0.252
97
3.81
1966
1.573616
1.02
Philadelphia Phillies
National
104.3
186
0.234
80
4.14
2004
2.158124
1.7
Pittsburgh Pirates
National
91.03
157
0.254
82
4
2001
1.465316
1.26
San Diego Padres
National
101.34
162
0.235
66
4.4
2004
2.168536
1.27
San Francisco Giants
American
205.67
176
0.254
89
4.13
2000
2.299489
2.85
Seattle Mariners
National
160.99
133
0.239
73
3.95
1999
3.156185
1.45
St. Louis Cardinals
National
163.78
205
0.249
88
3.85
2006
3.403587
1.9
Tampa Bay Rays
American
68.81
150
0.258
90
3.74
1990
1.154973
0.9
Texas Rangers
American
140.63
194
0.24
67
4.92
1994
2.107107
1.6
Toronto Blue Jays
American
150.95
217
0.244
73
4.85
1989
2.325281
1.35
Washington Nationals
National
181.38
191
0.254
82
4.04
2008
2.529604
1.675
Expert Solution
This question has been solved!
Explore an expertly crafted, step-by-step solution for a thorough understanding of key concepts.

This is a popular solution!

Trending now
This is a popular solution!

Step by step
Solved in 2 steps

Recommended textbooks for you
Glencoe Algebra 1, Student Edition, 9780079039897…
Algebra
ISBN:
9780079039897
Author:
Carter
Publisher:
McGraw Hill
Glencoe Algebra 1, Student Edition, 9780079039897…
Algebra
ISBN:
9780079039897
Author:
Carter
Publisher:
McGraw Hill